

 Forms, Reports, and BI Dashboards
Vista-Suite Enterprise gives teams built-in tools for creating, viewing, and sharing information through custom forms, dashboards, and external reporting platforms. It includes an integrated Forms and Reports Designer, a responsive Dashboard Viewer, and native ODBC connectivity for tools like Power BI and Crystal Reports without relying on exports or workarounds.
Many systems limit this kind of direct access. Vista-Suite Enterprise takes a different approach with structured, secure connectivity that helps your team display and analyze information in the ways your work requires.
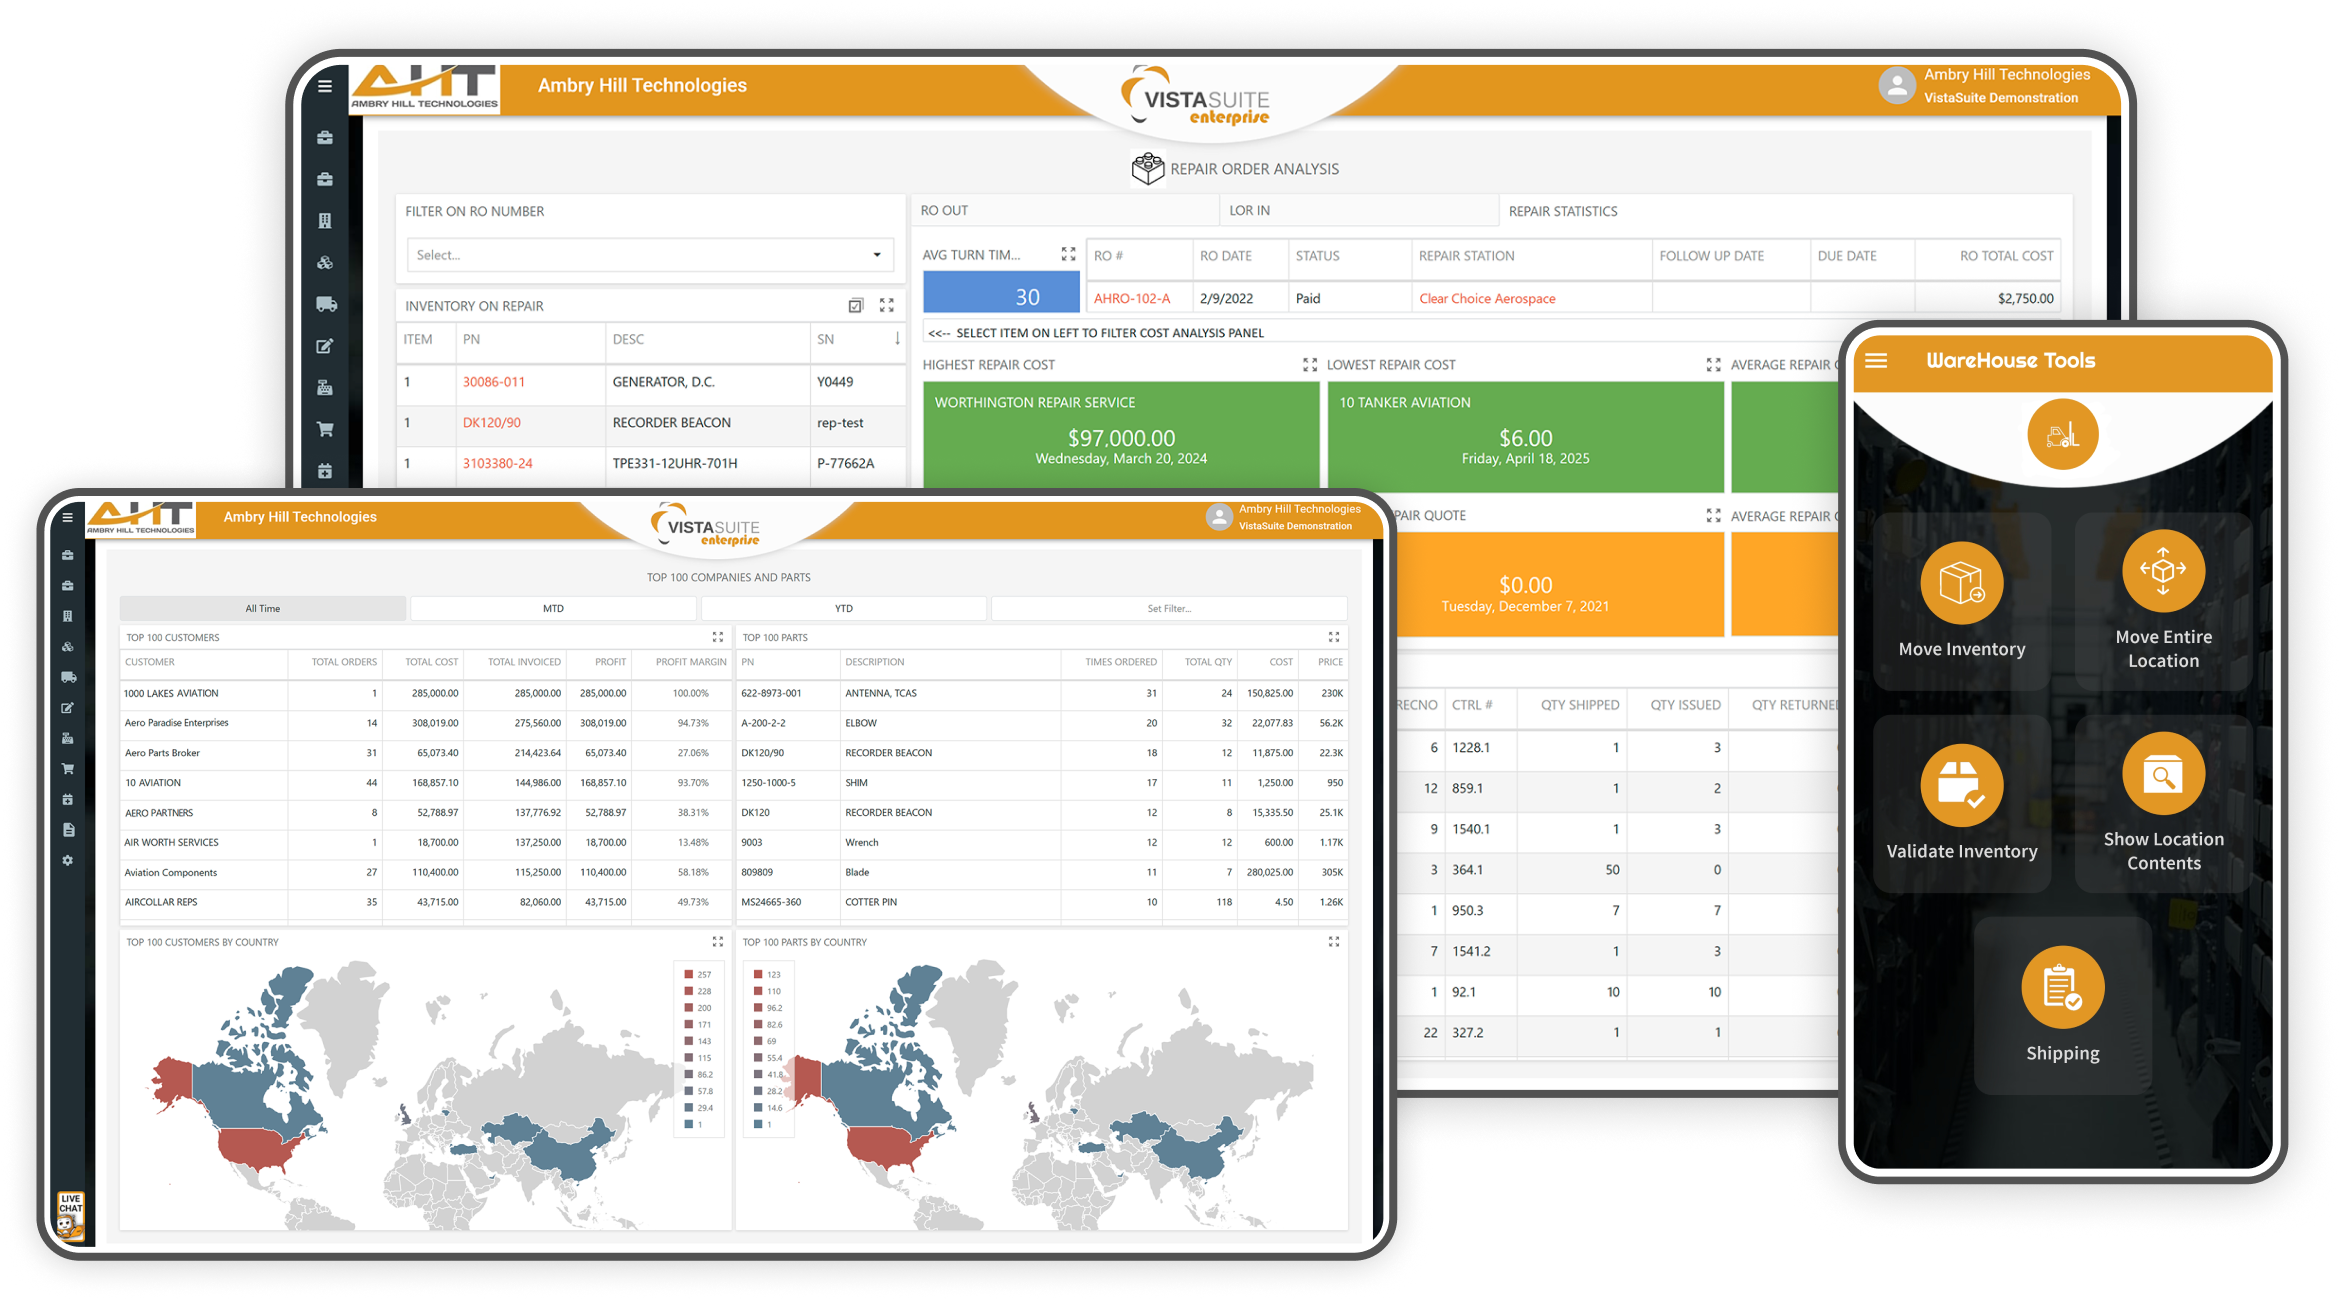
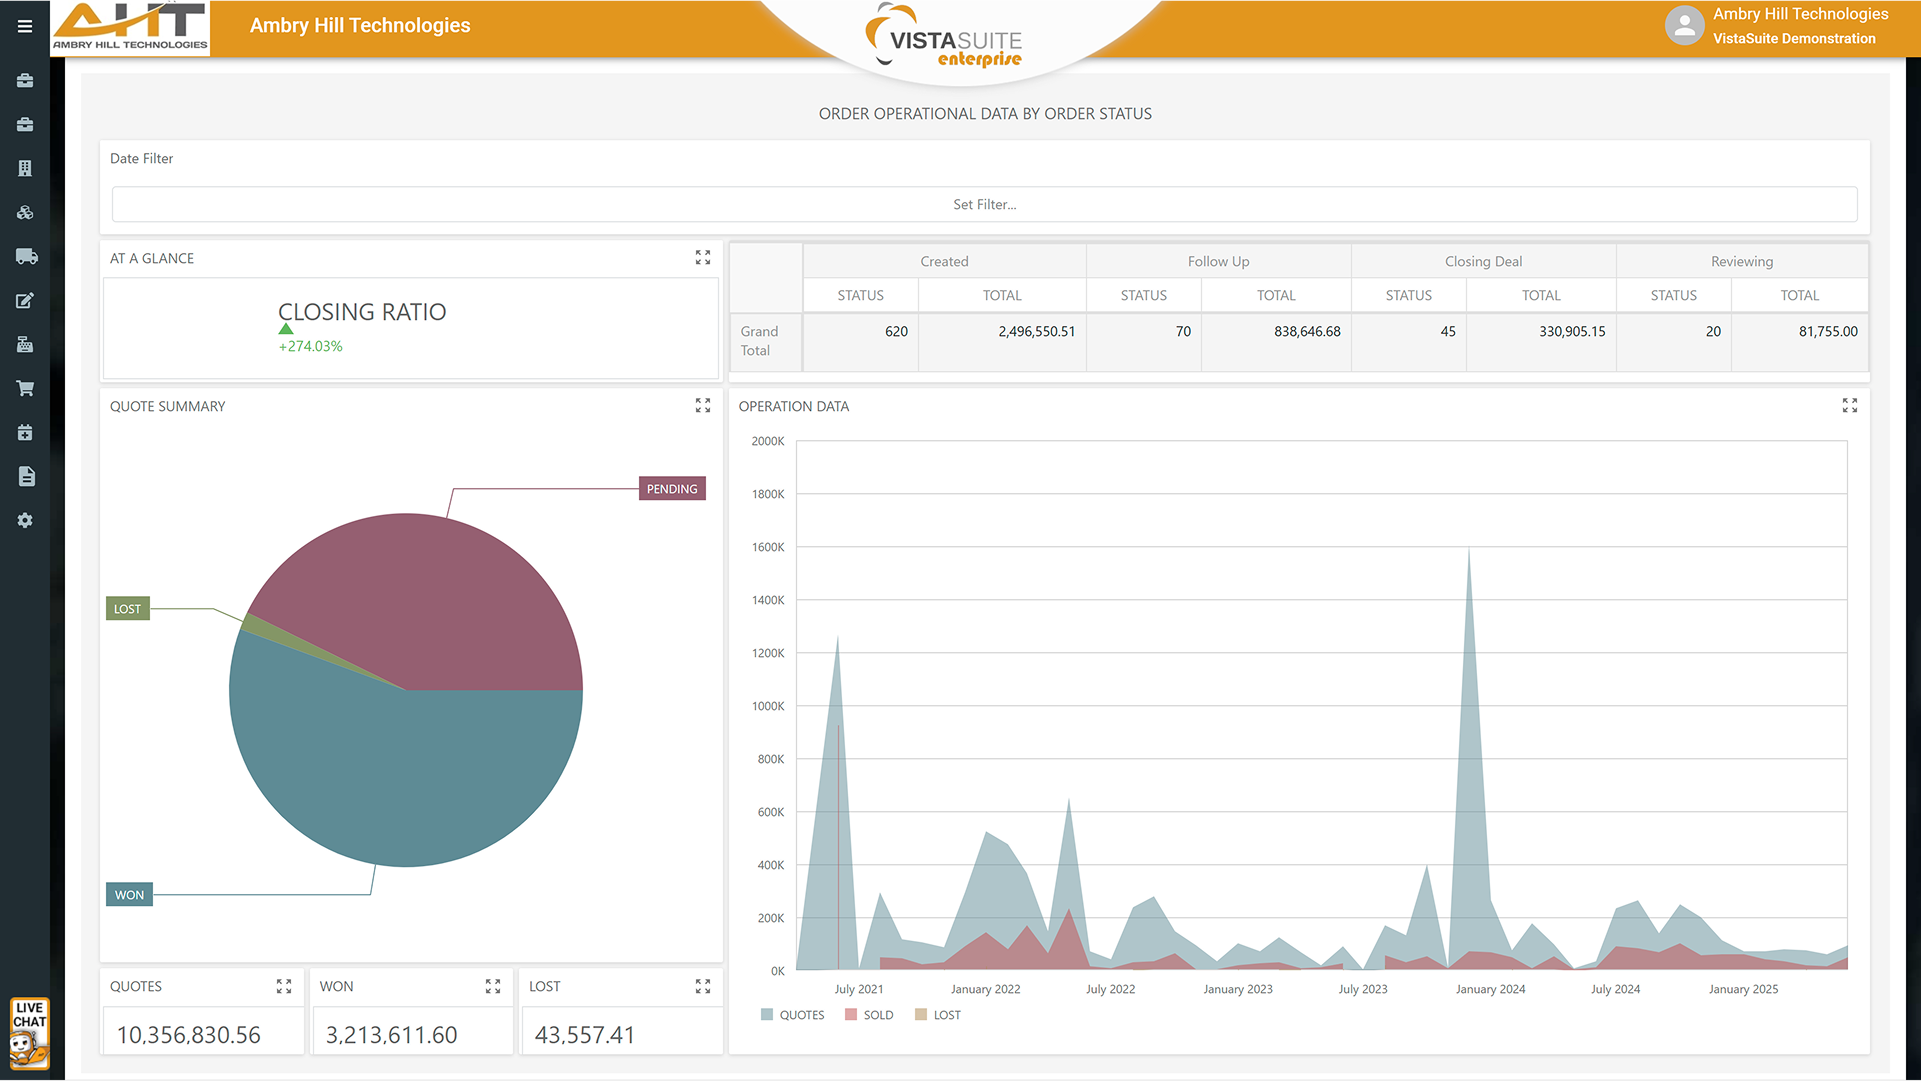
The Vista-Suite Enterprise Dashboard Viewer empowers users to explore business-critical data through rich, interactive dashboards. While dashboards are created and maintained by the Vista-Suite Enterprise team, end users can view them, interact with filters, and request changes as needed.
The Dashboard Viewer offers a dynamic and intuitive experience that helps users quickly identify trends, spot exceptions, and make informed decisions based on real-time or historical data.
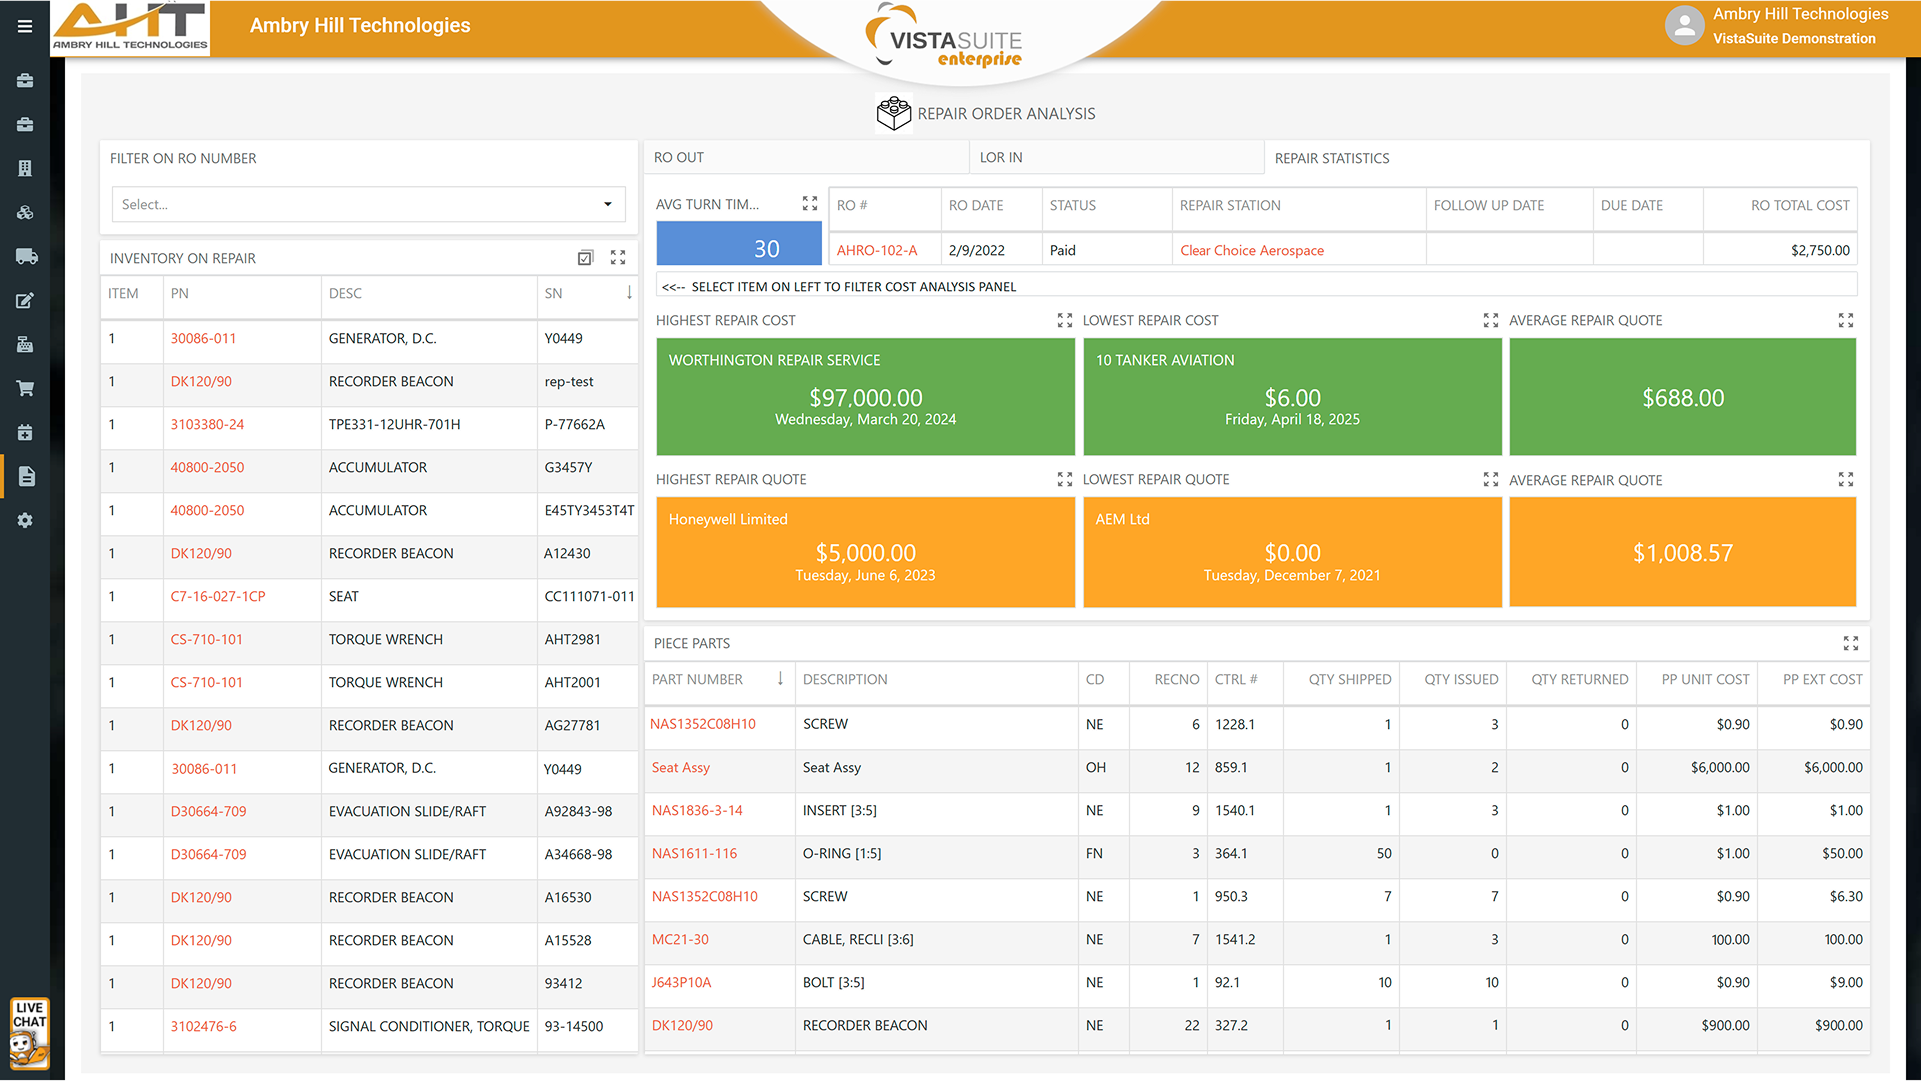
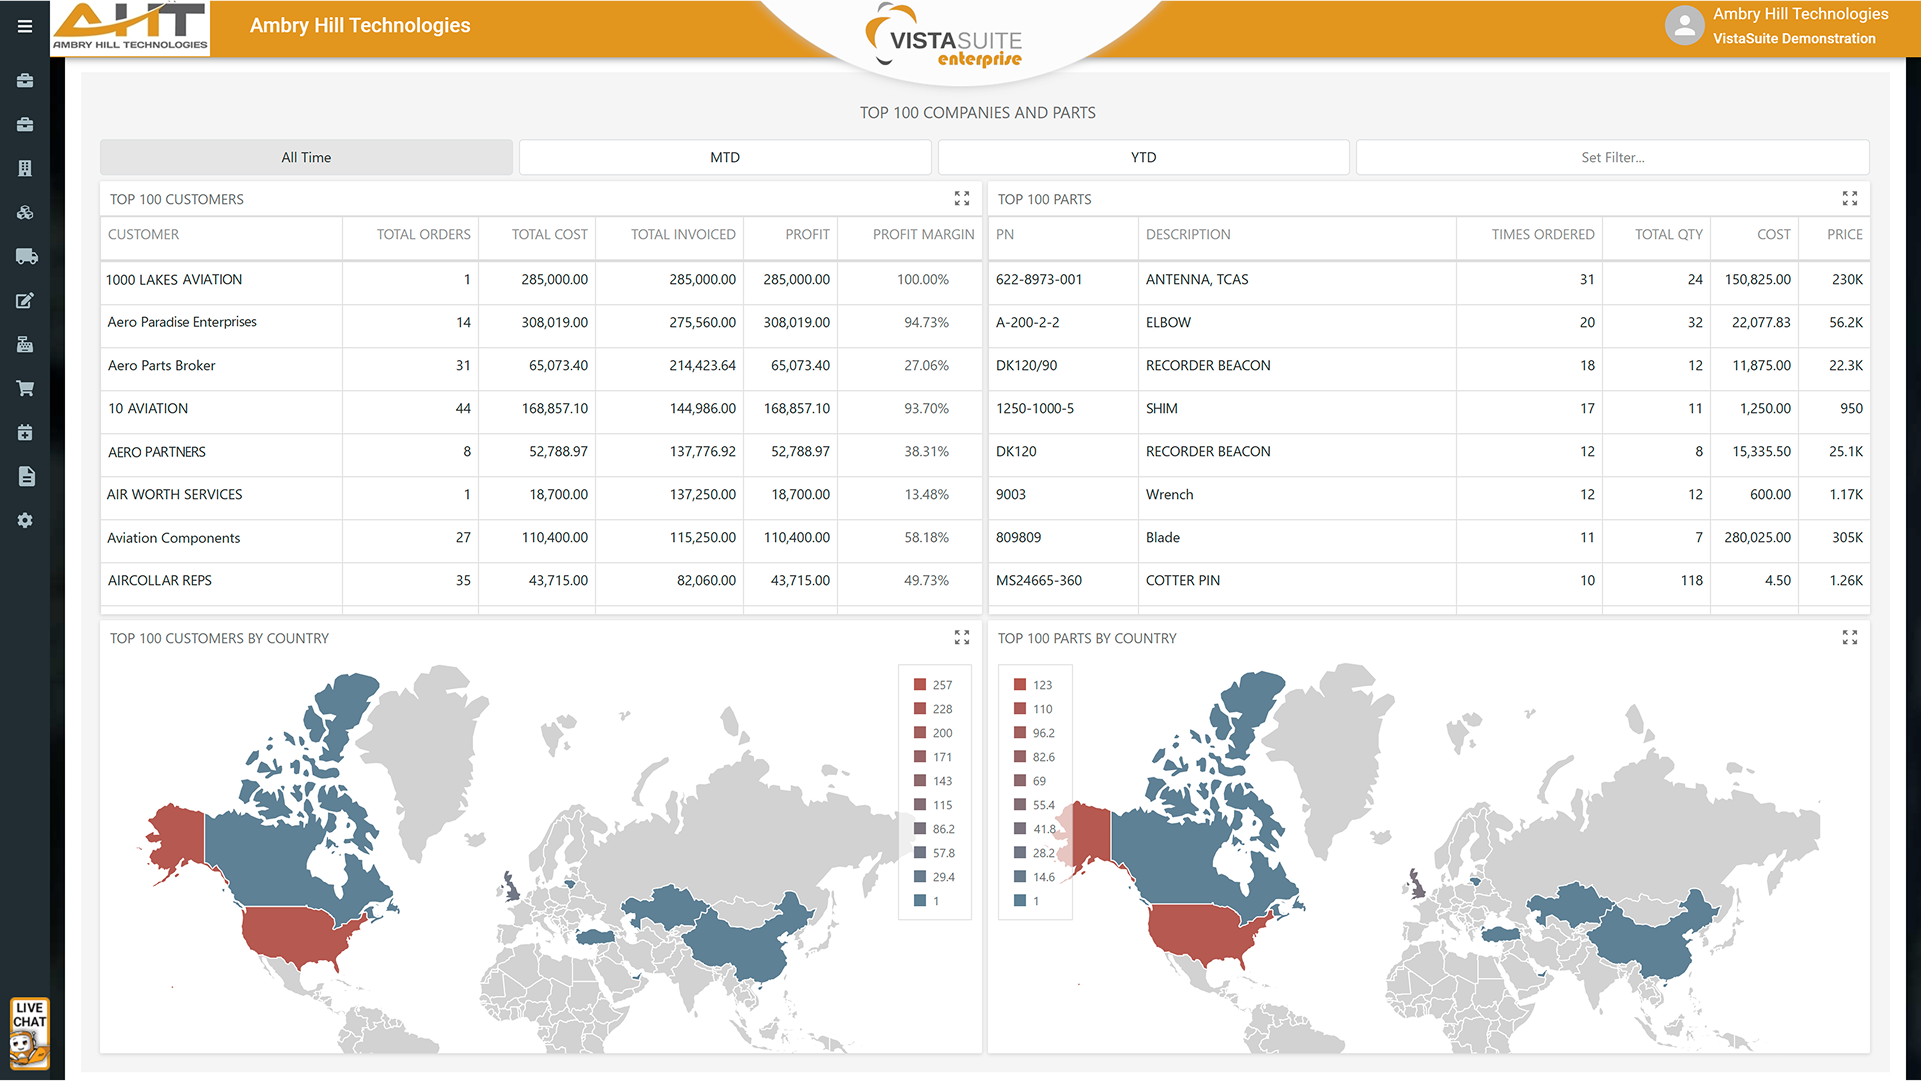
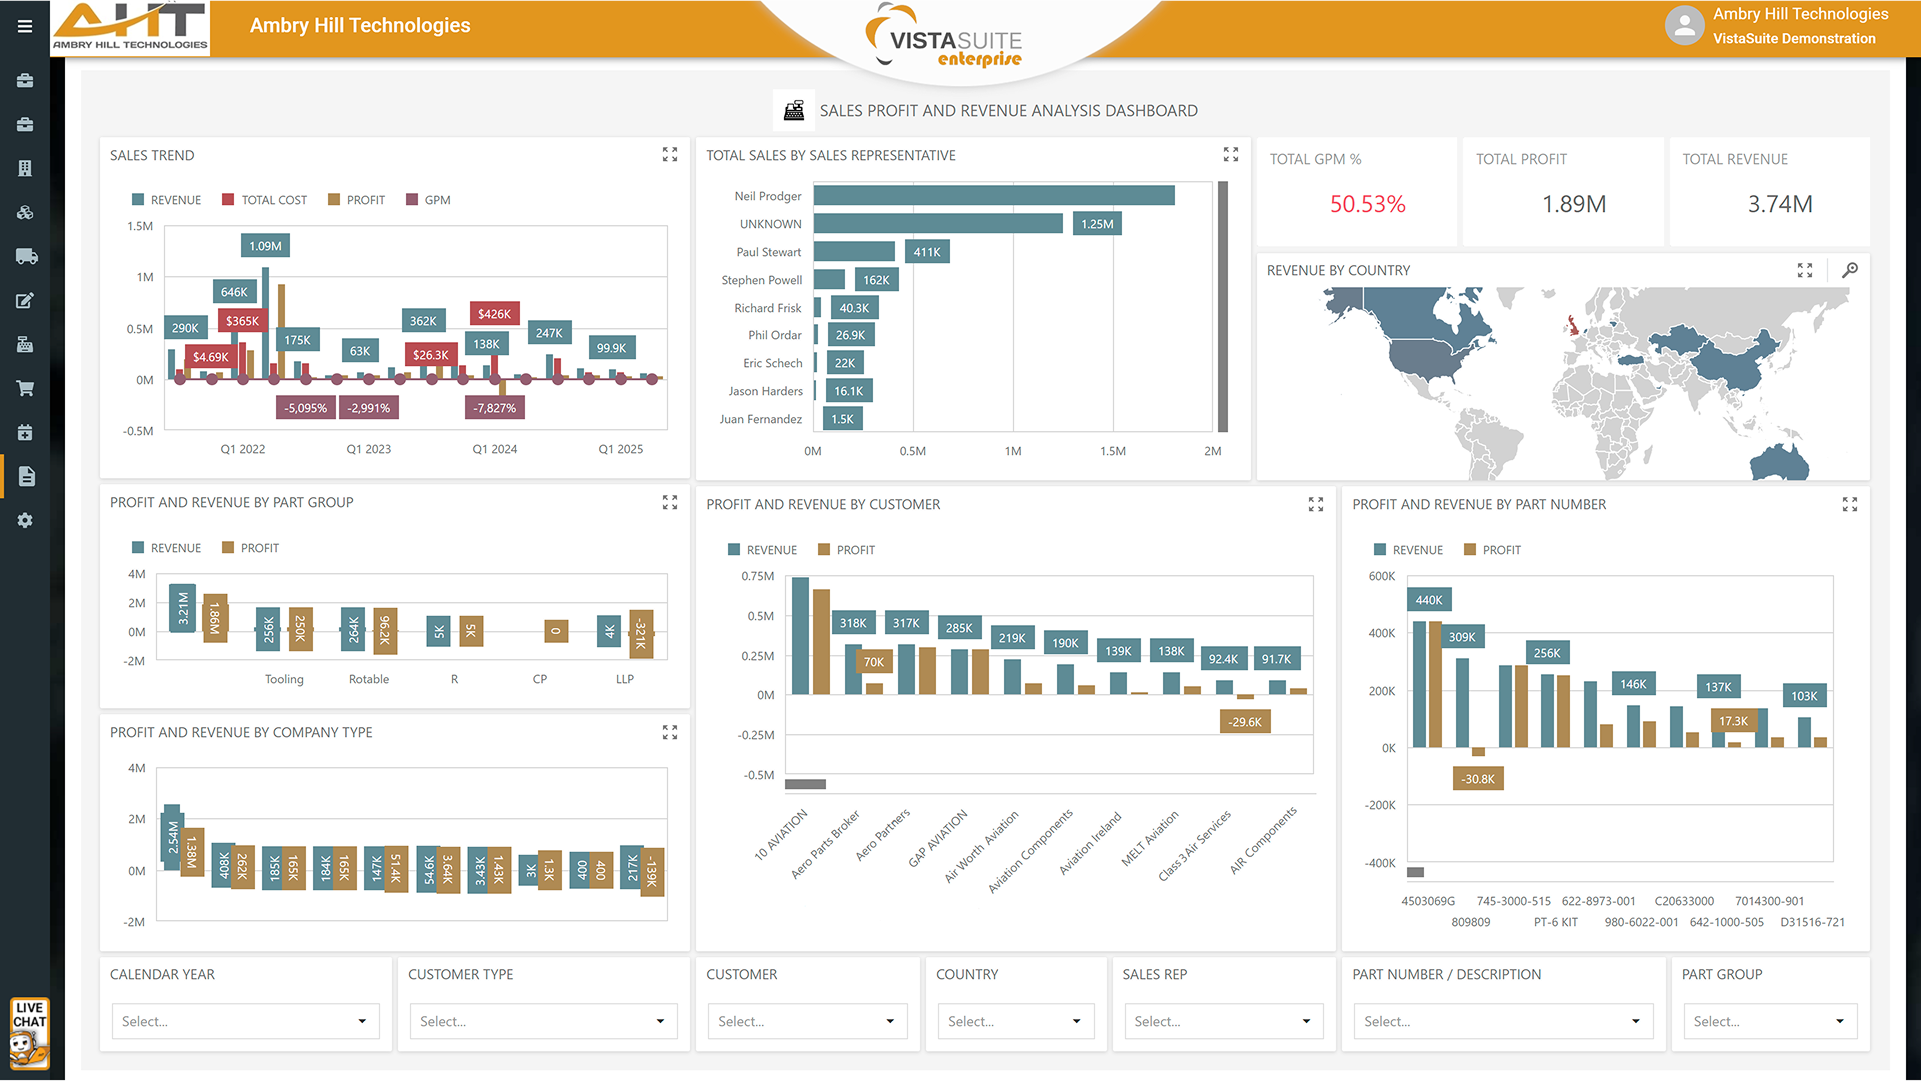
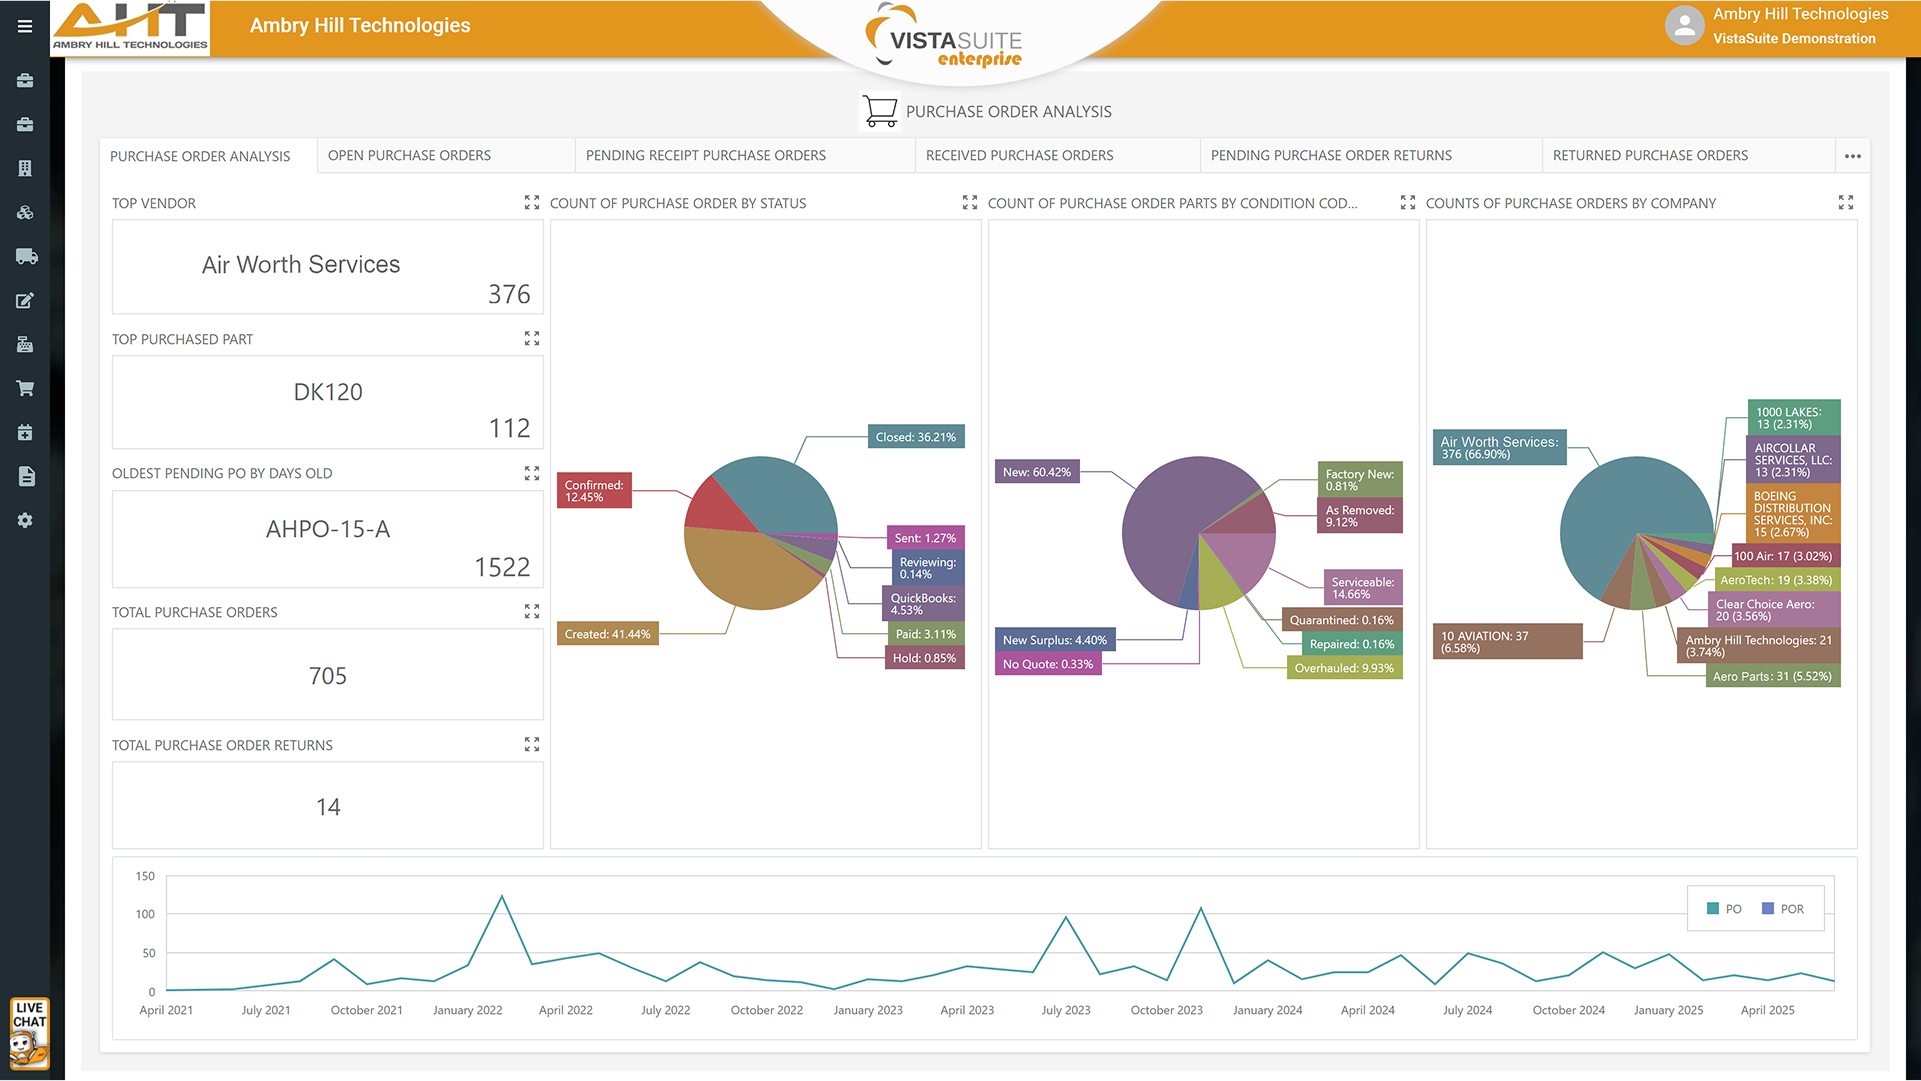
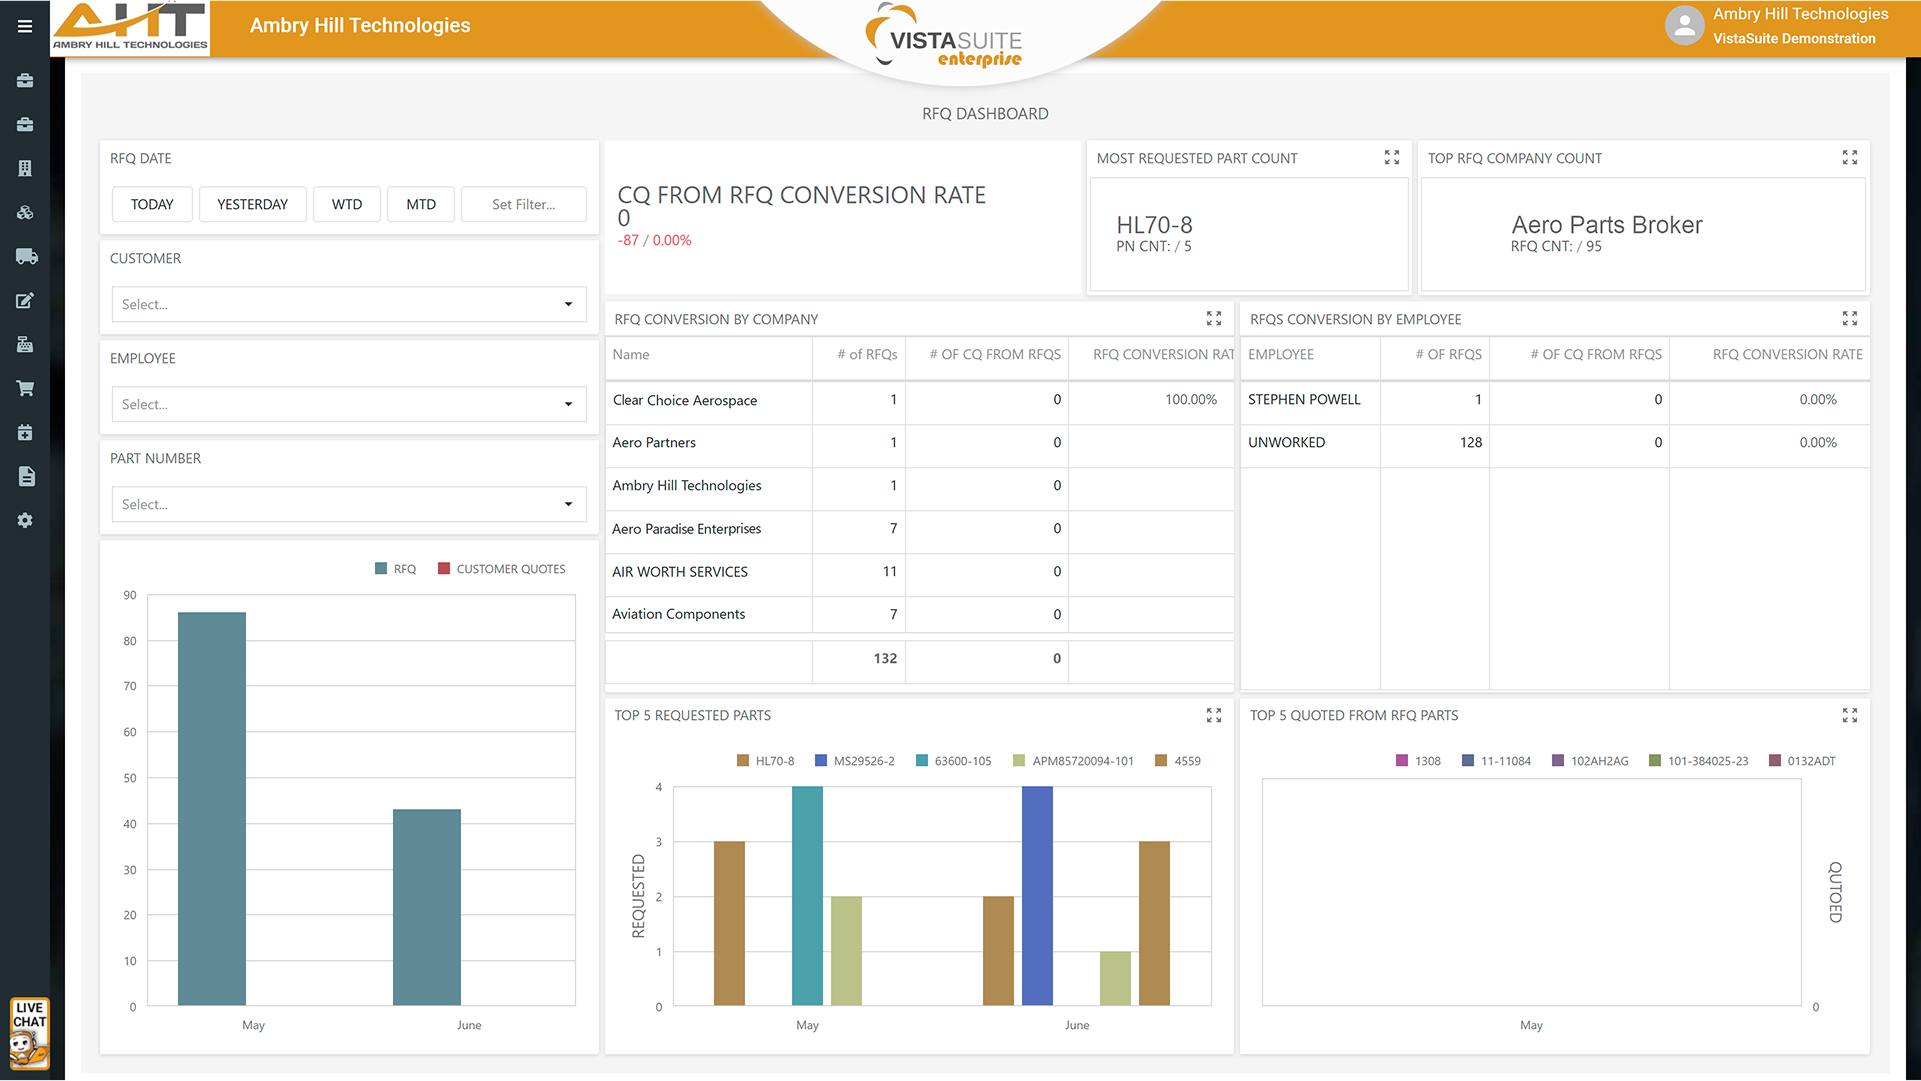
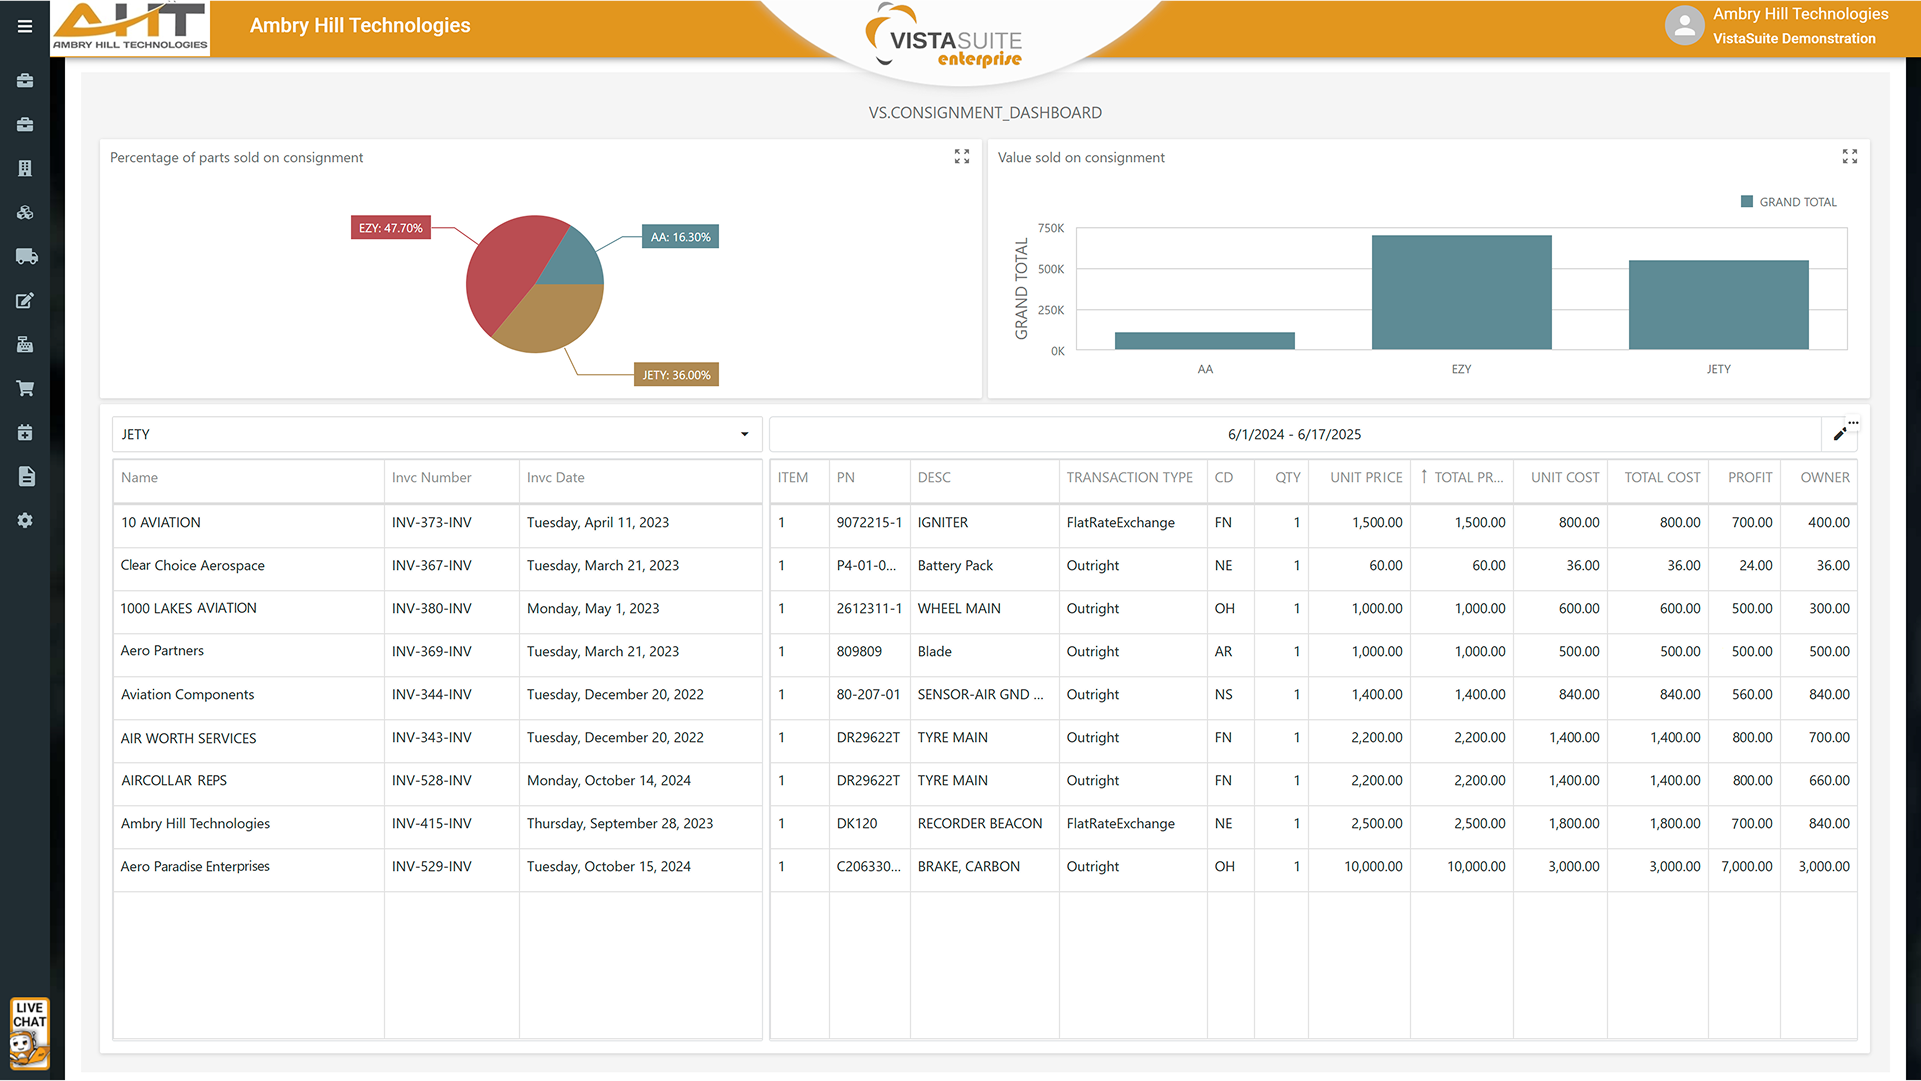
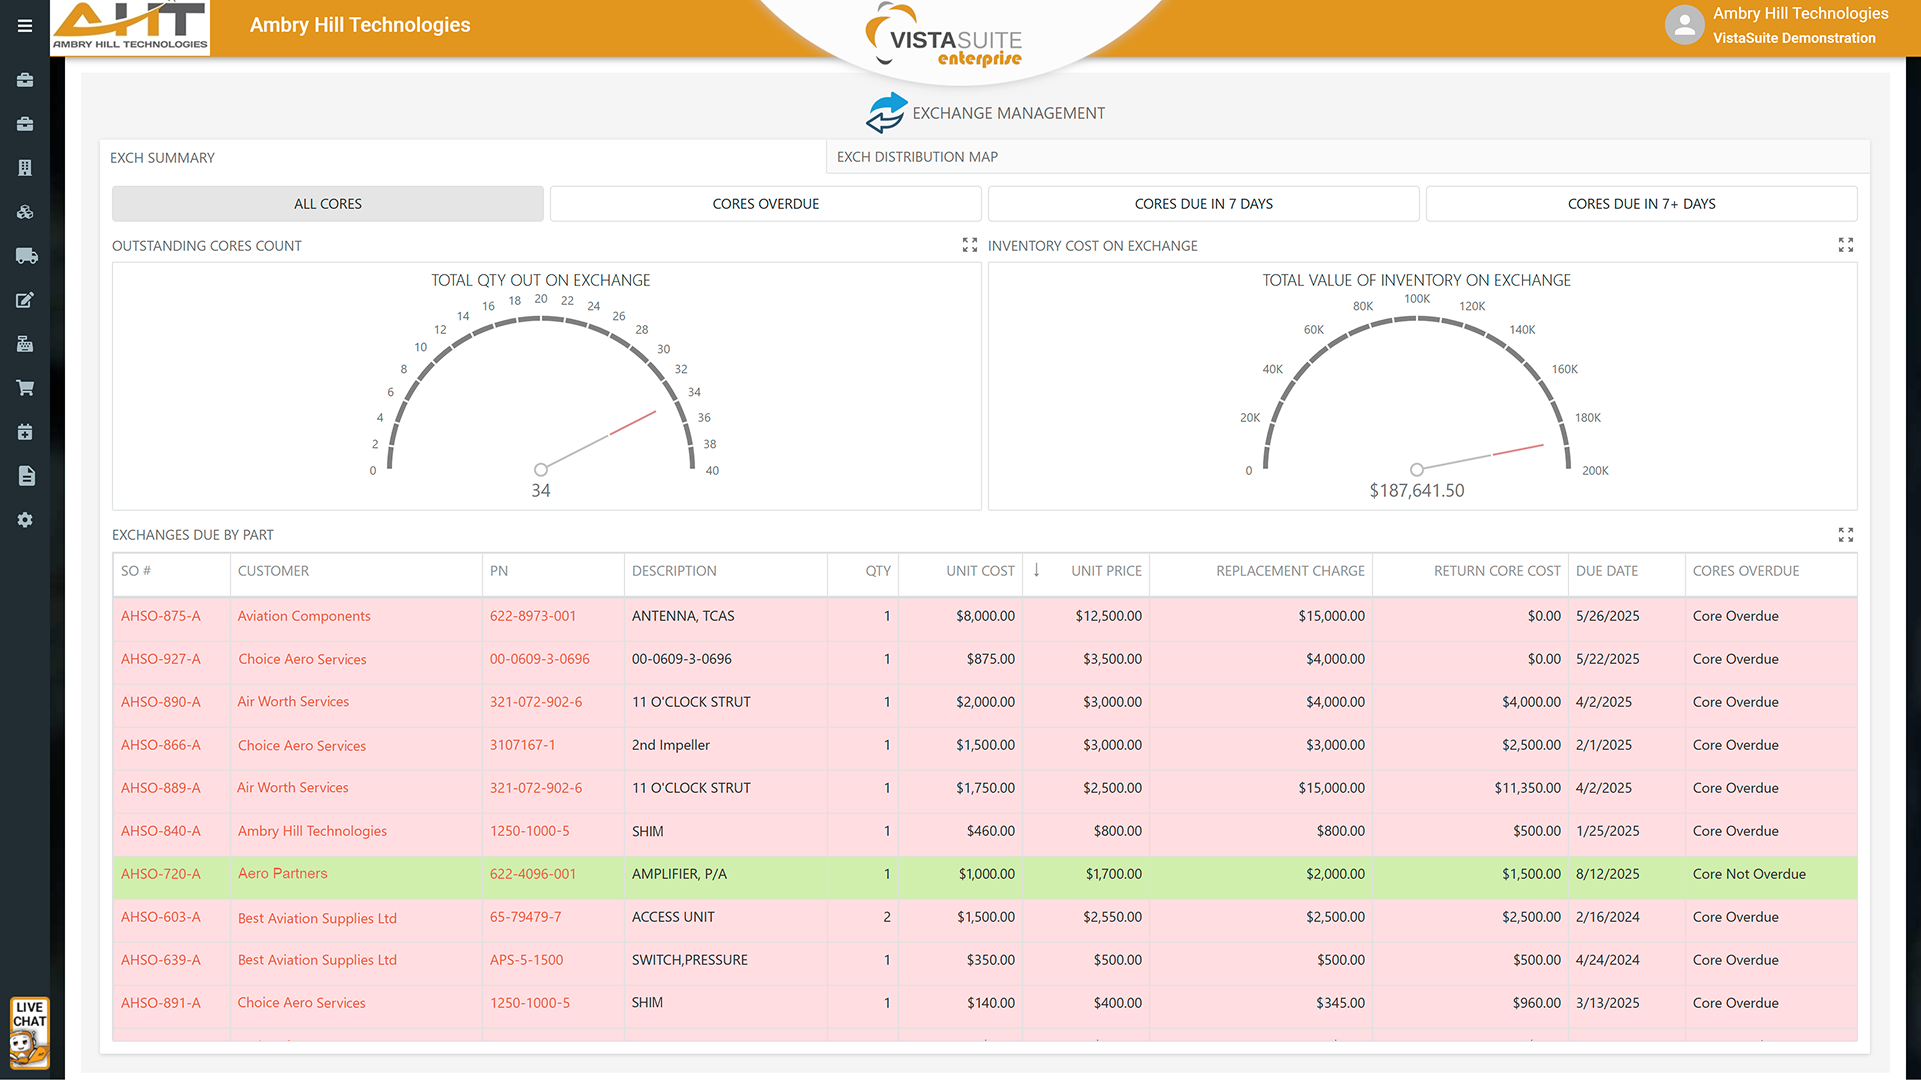
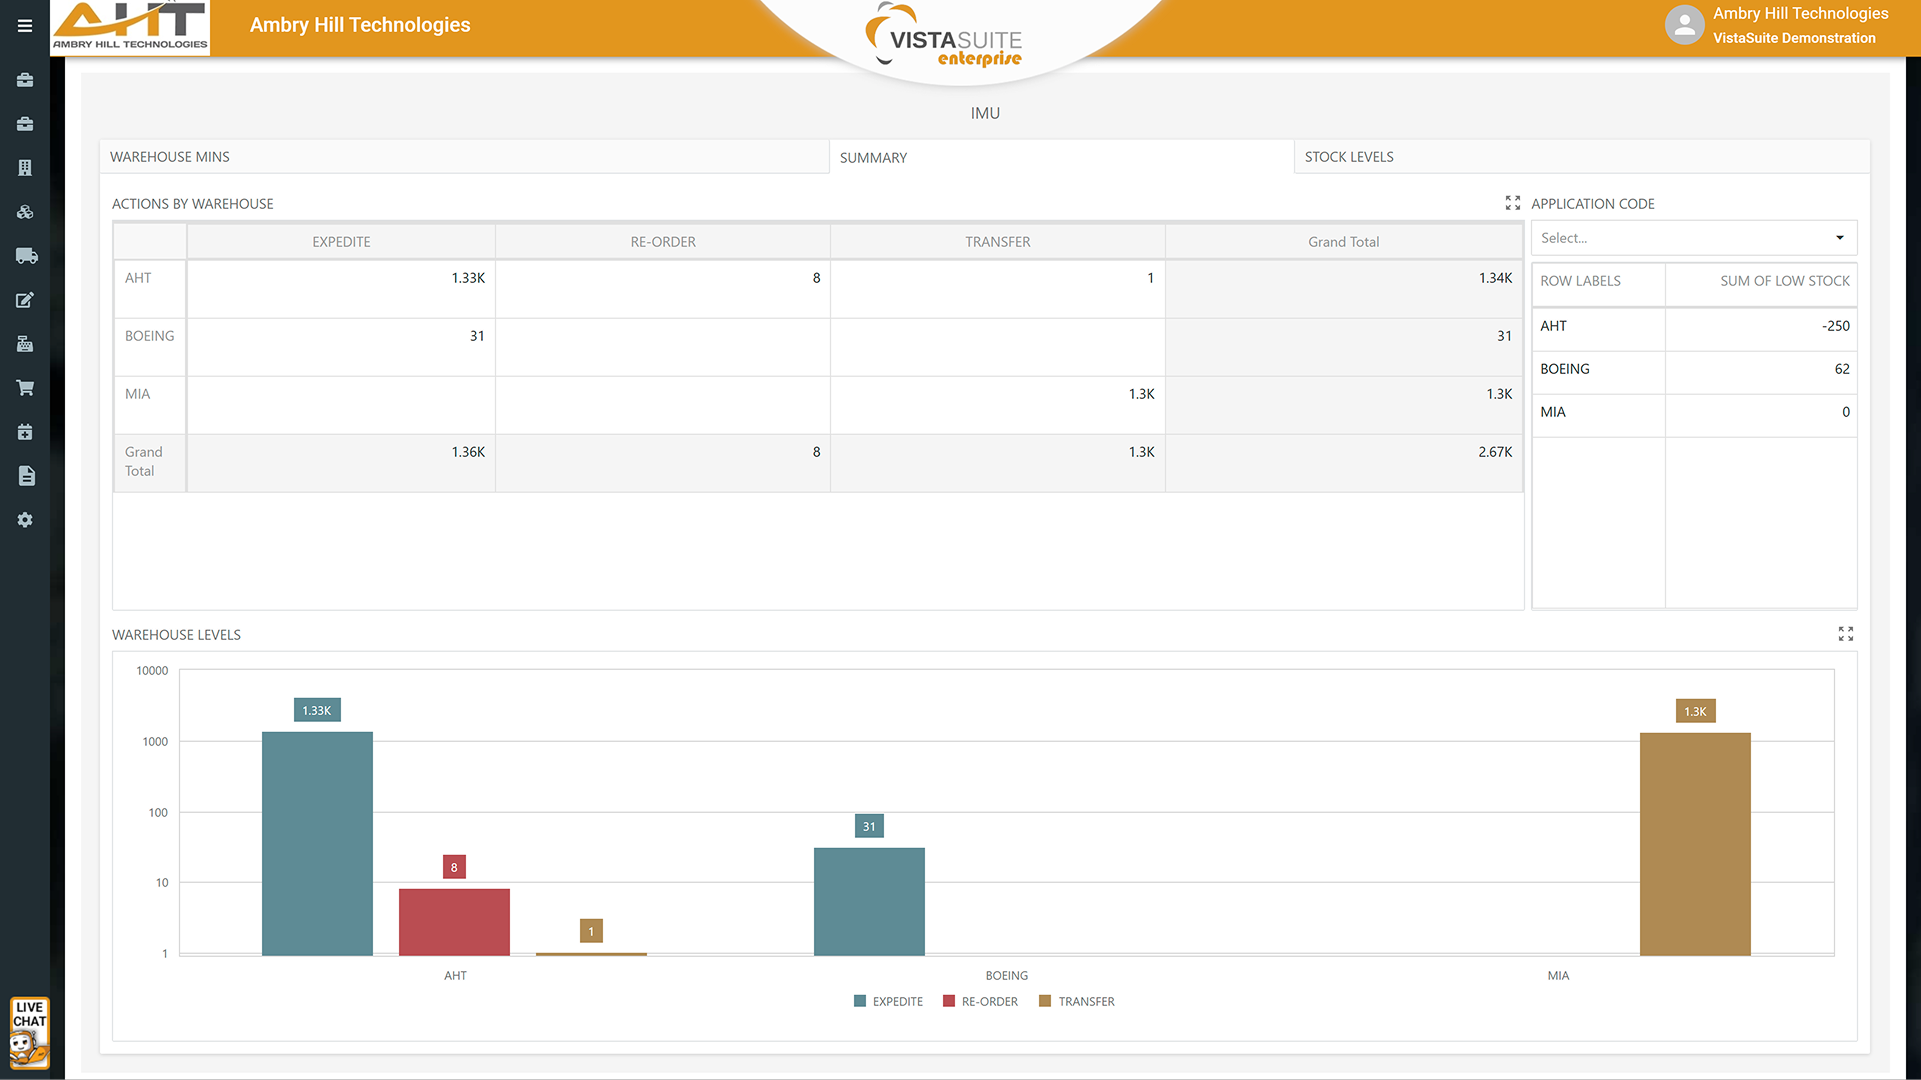
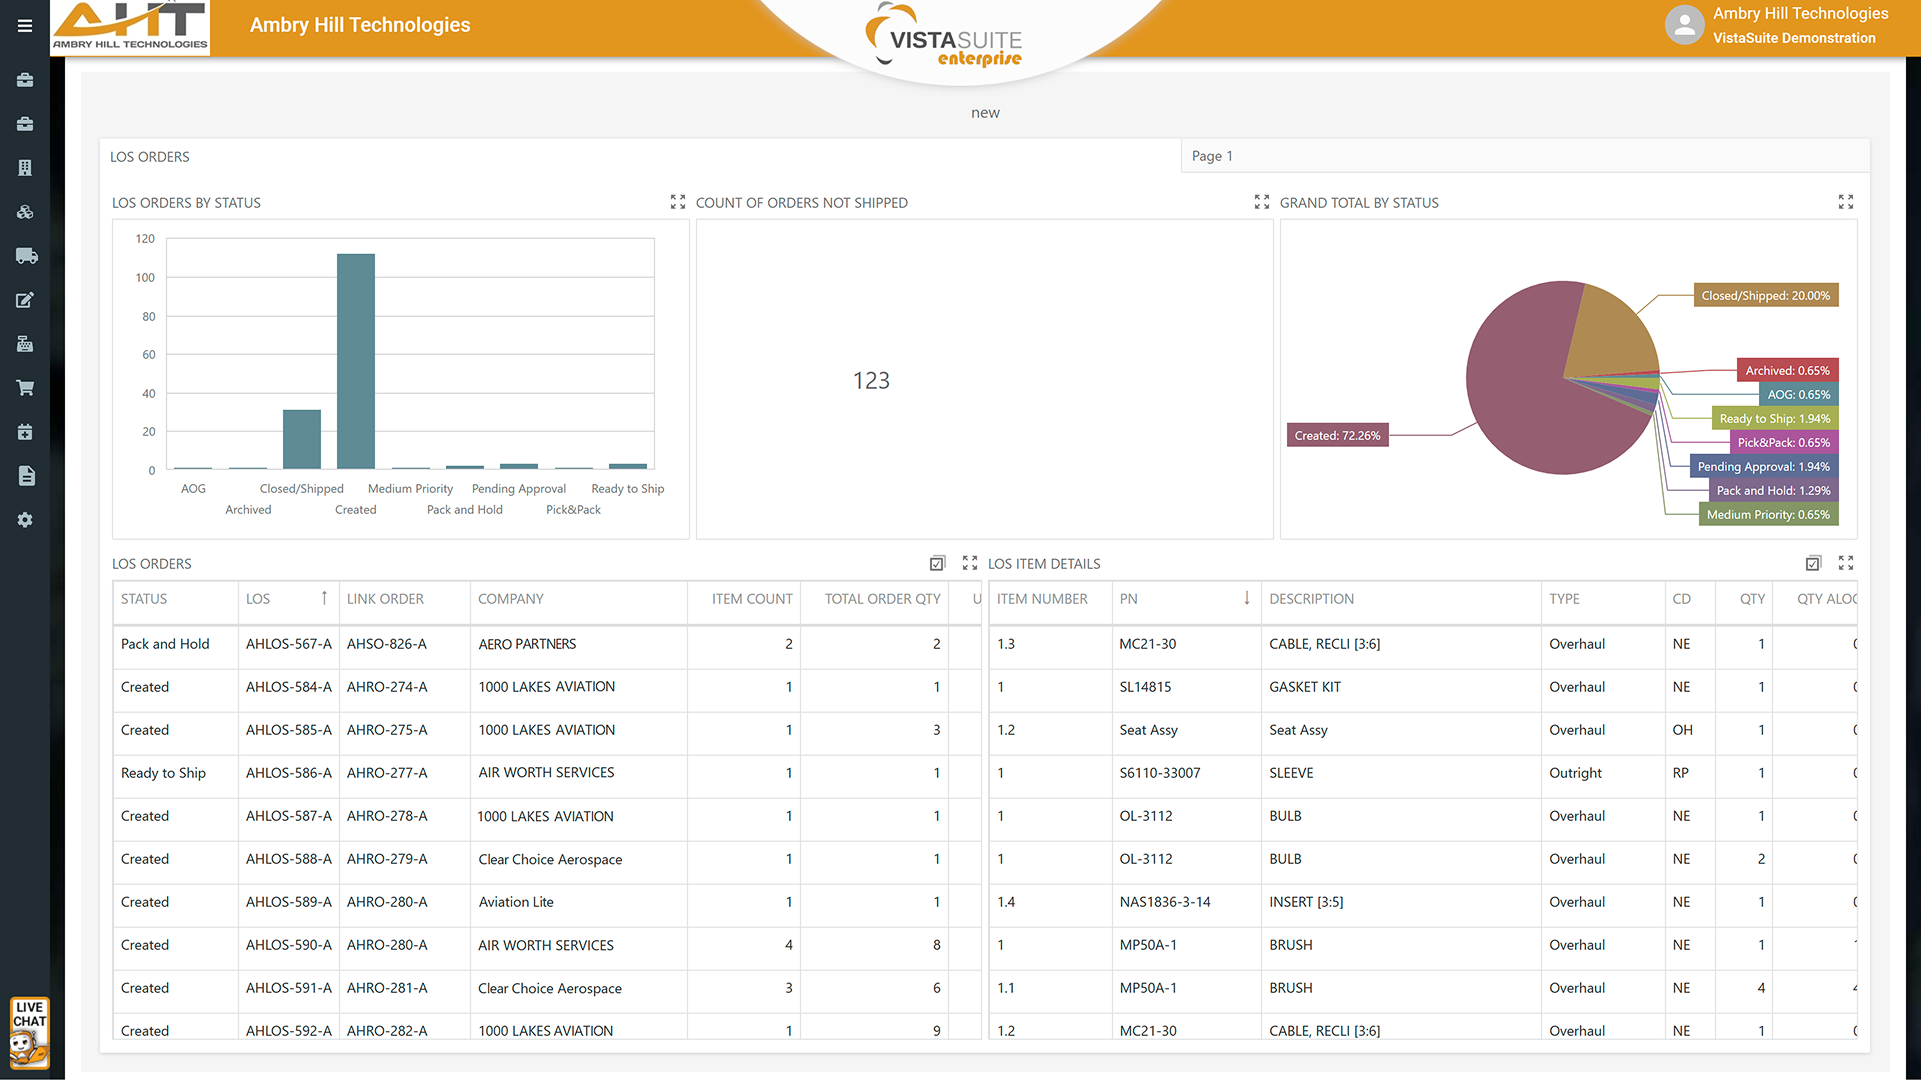
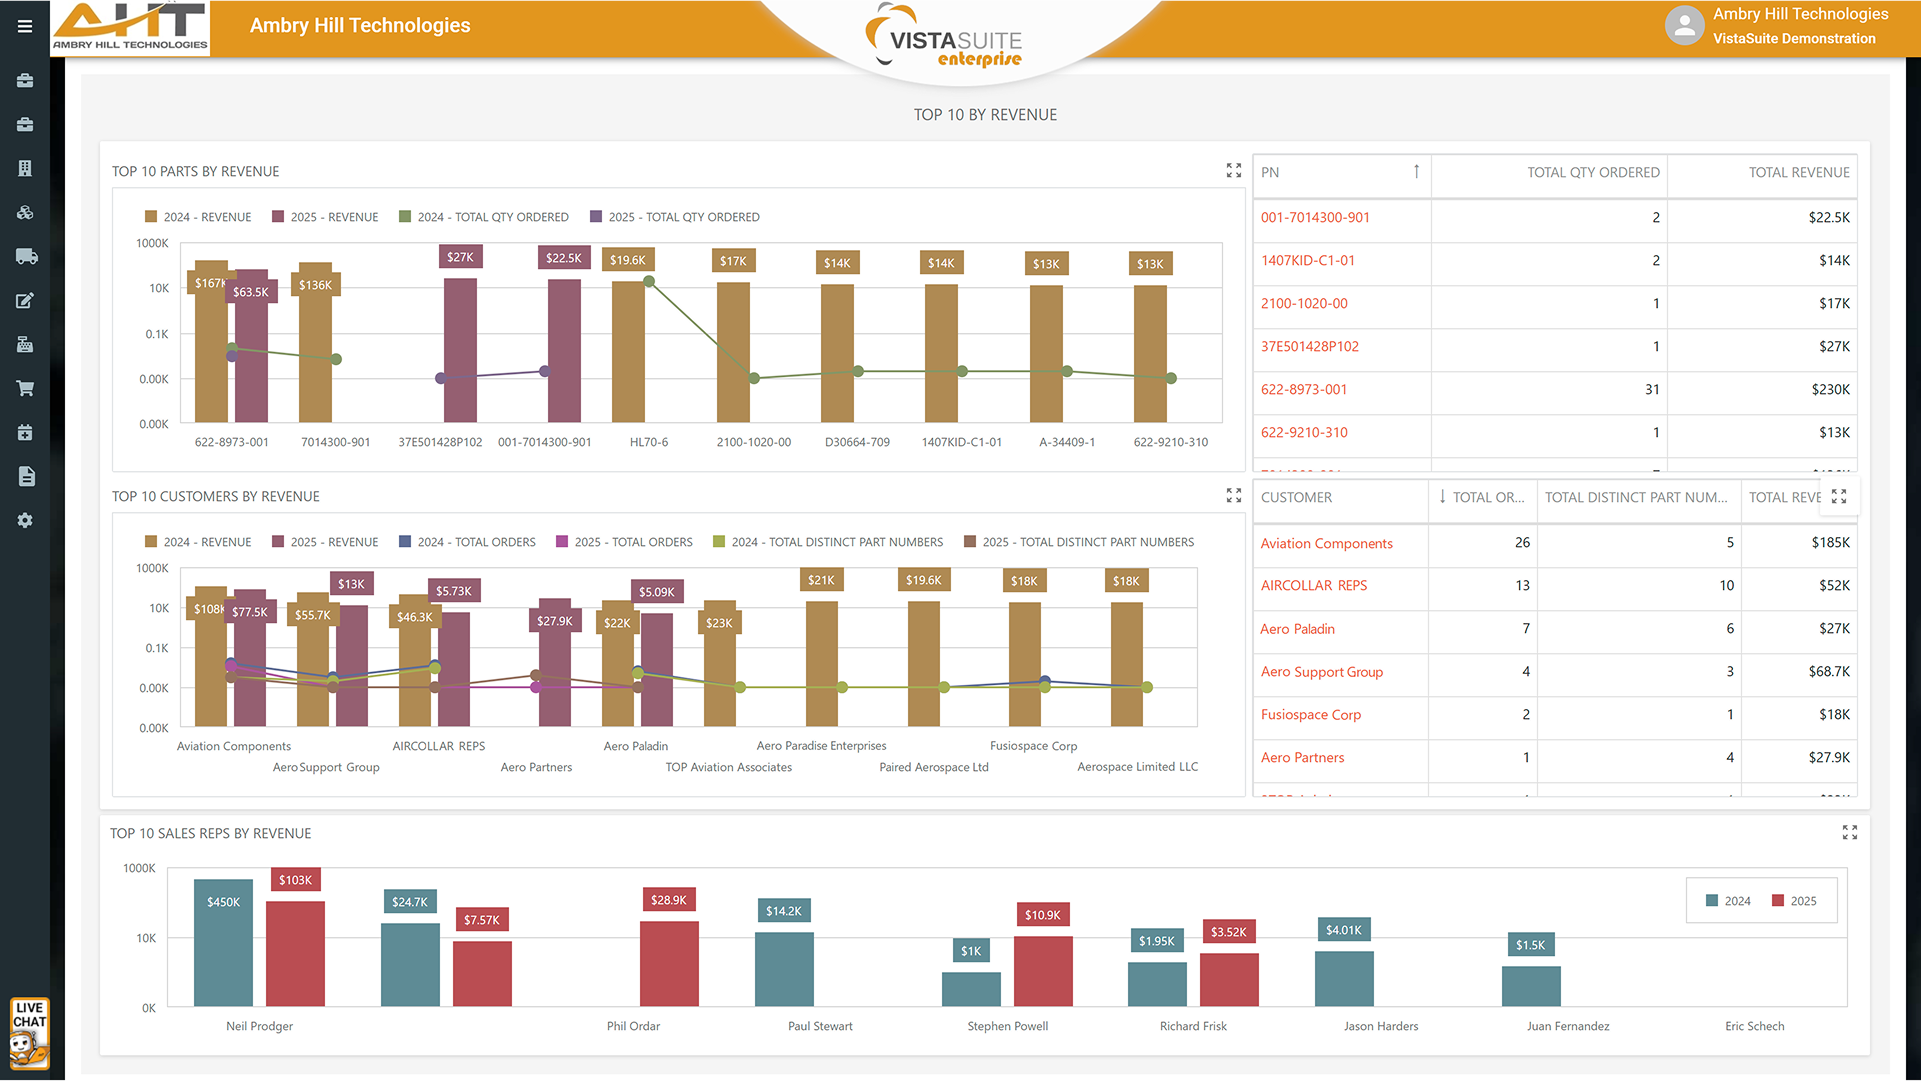
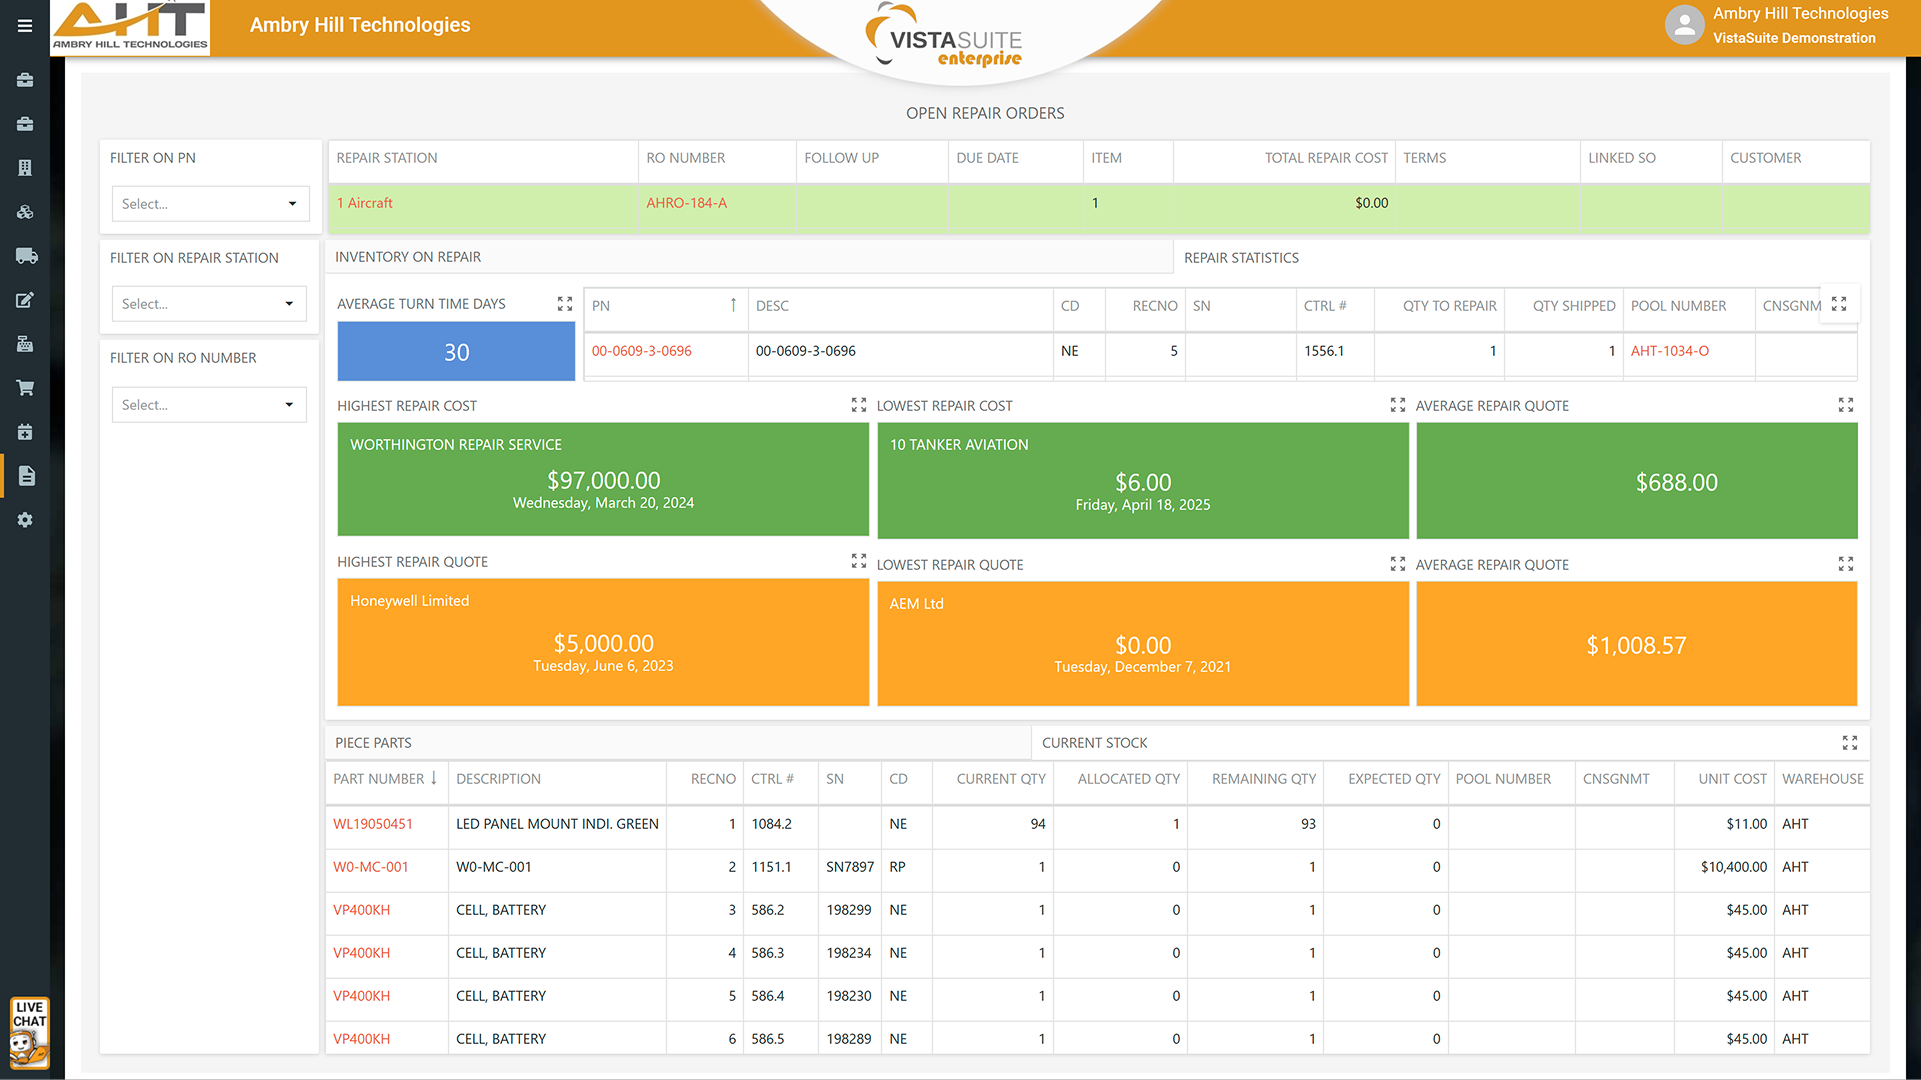
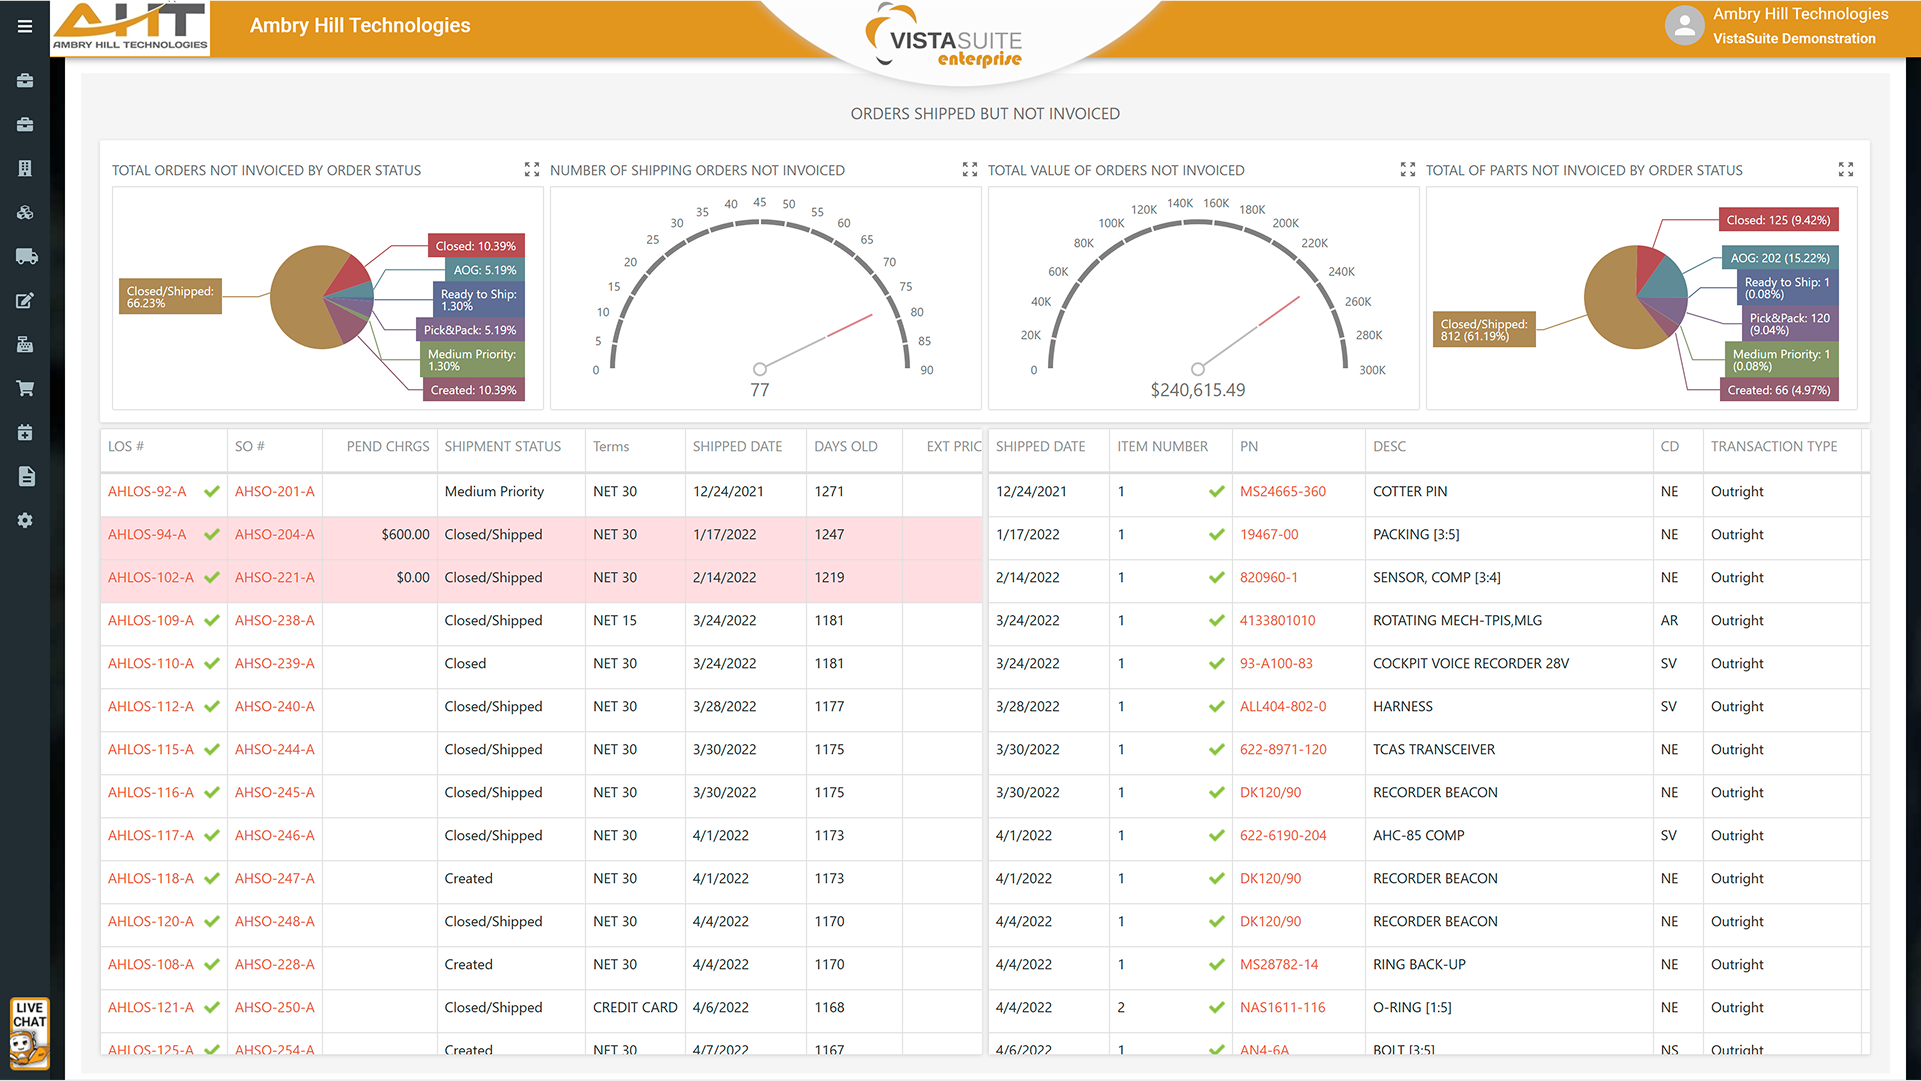
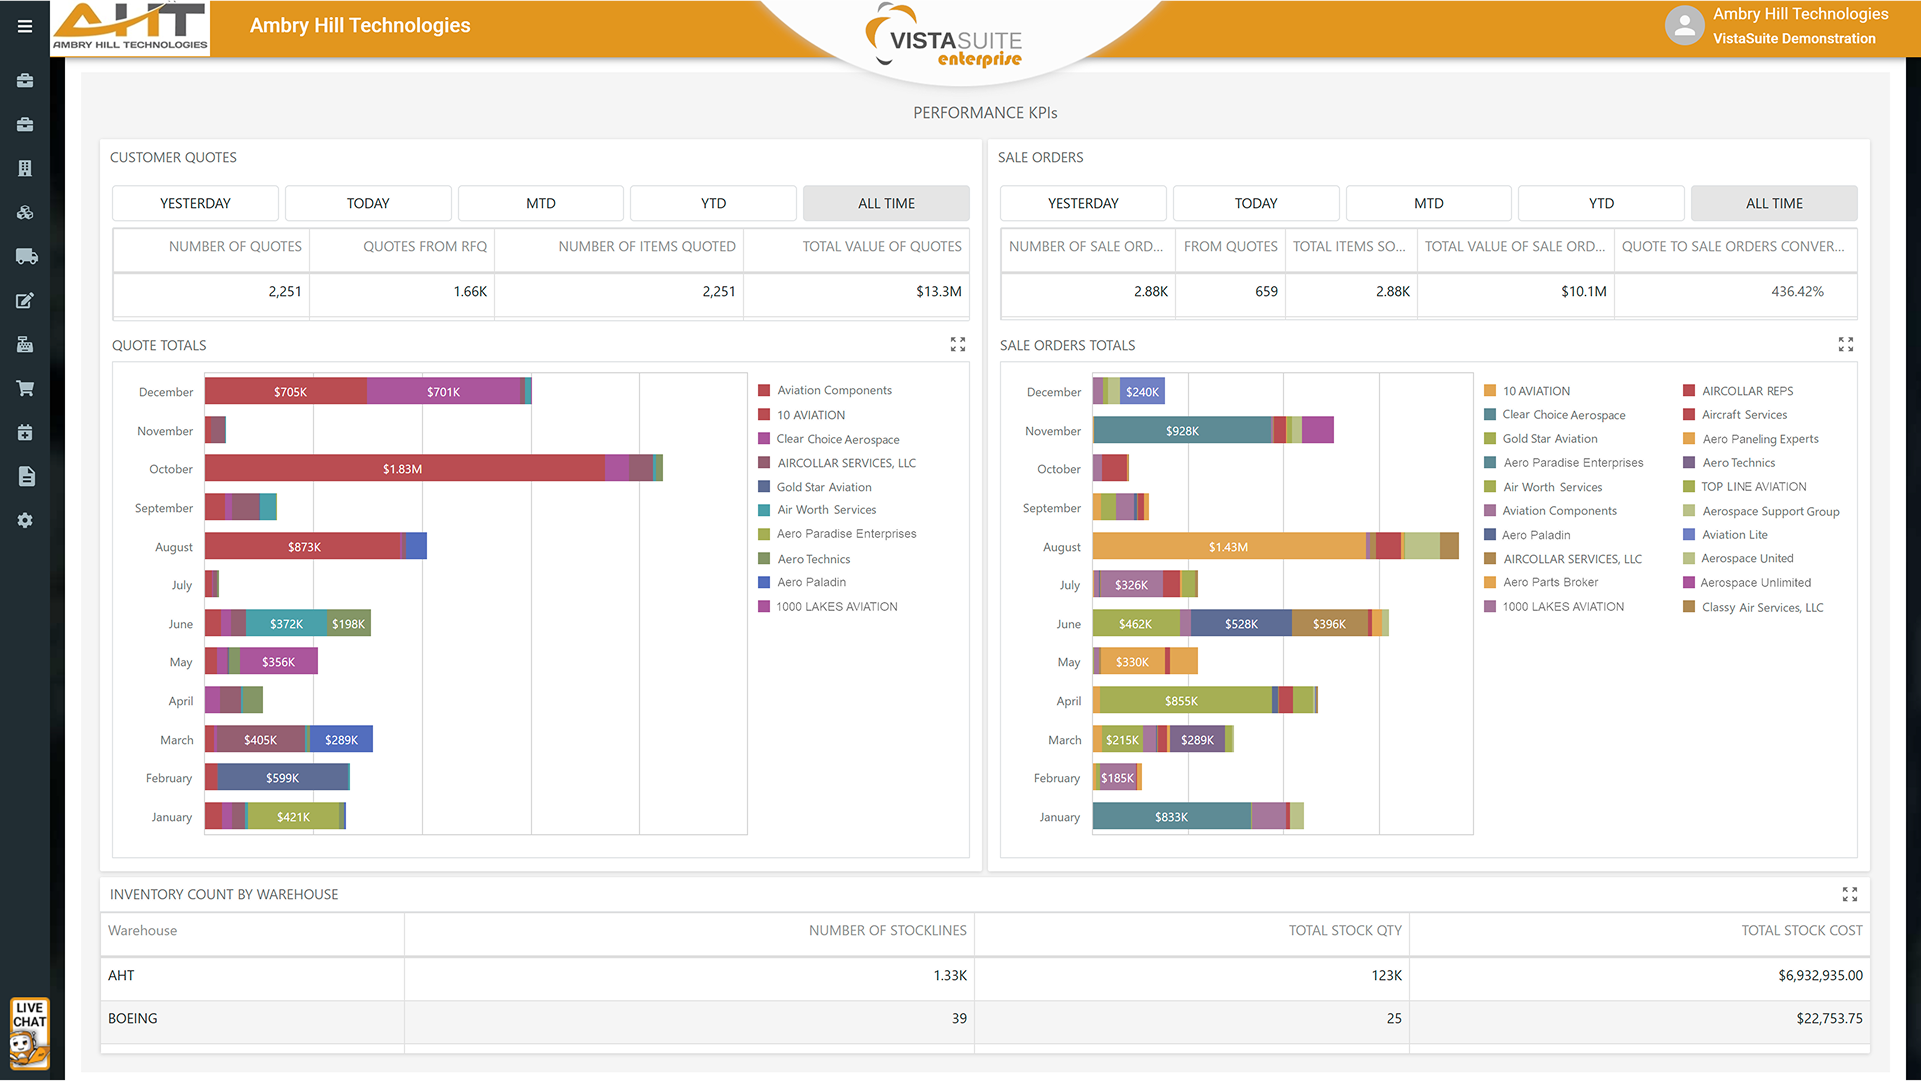
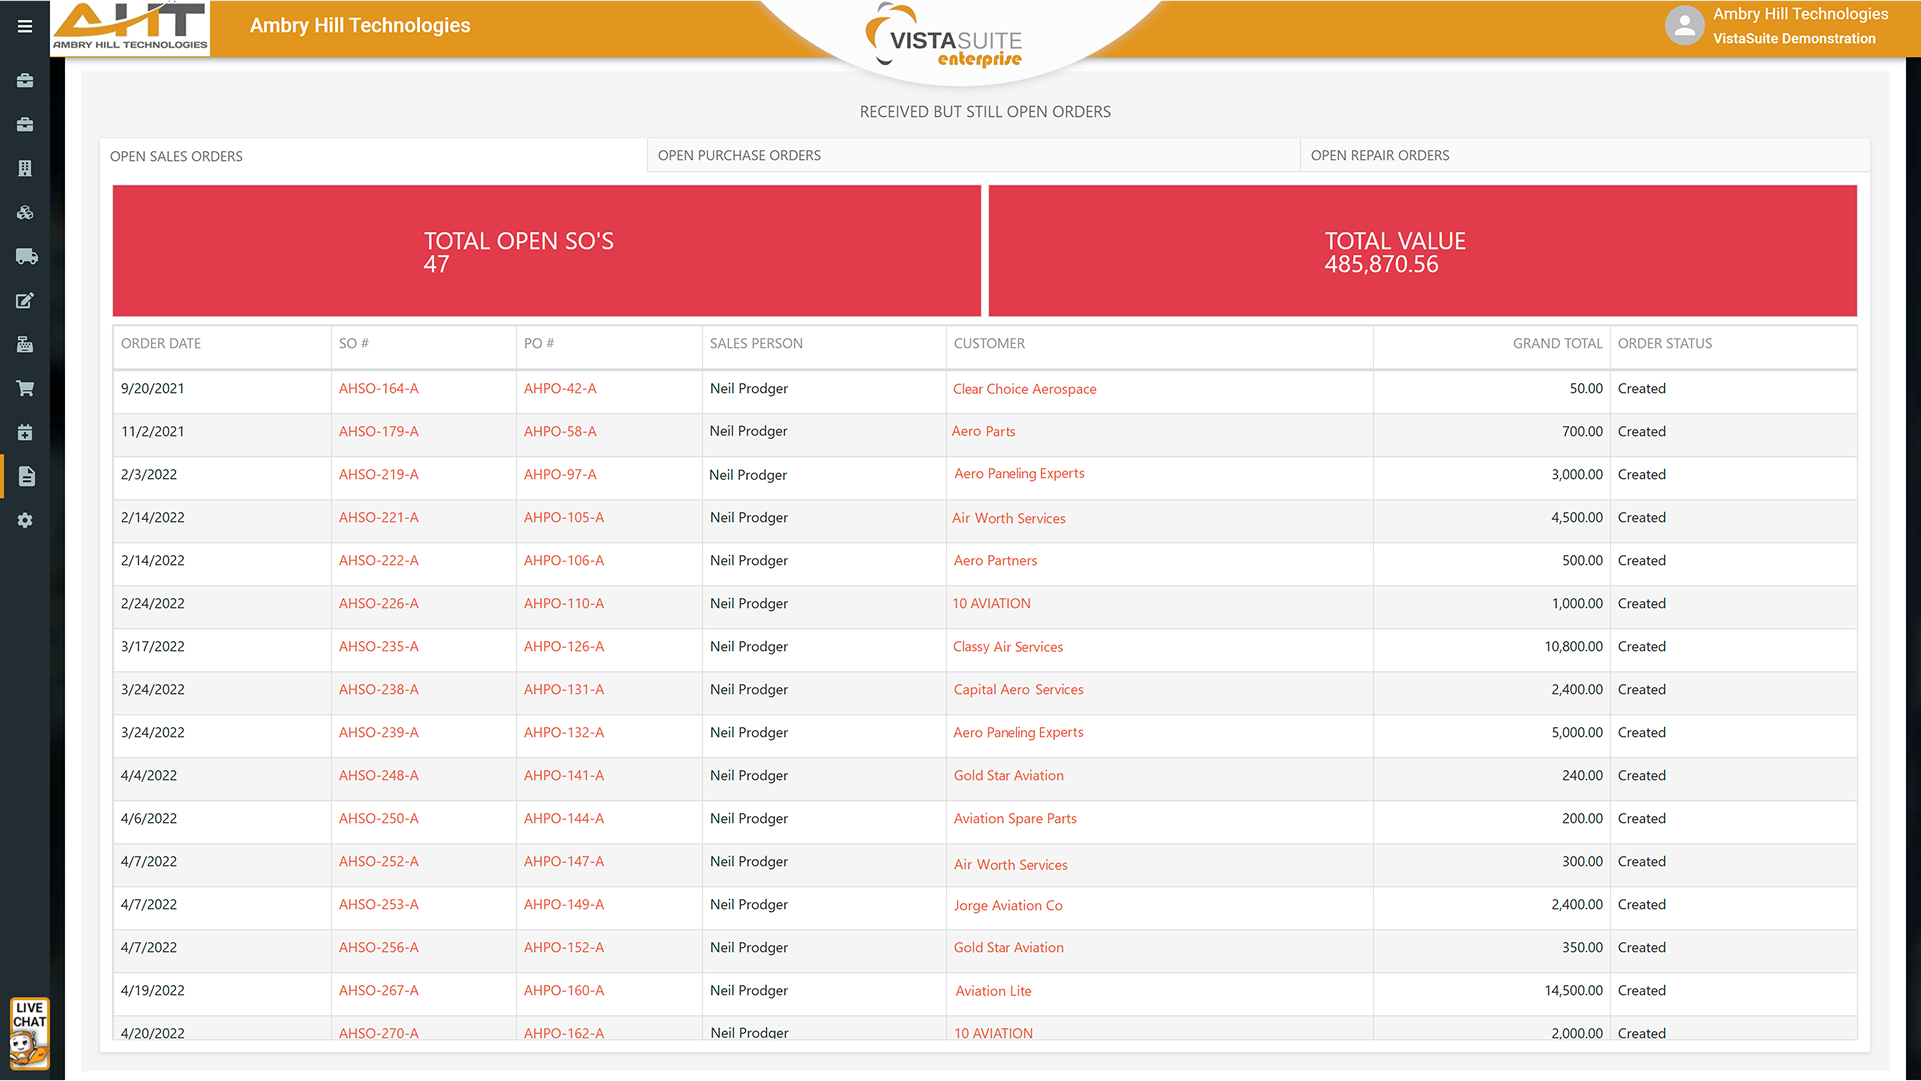
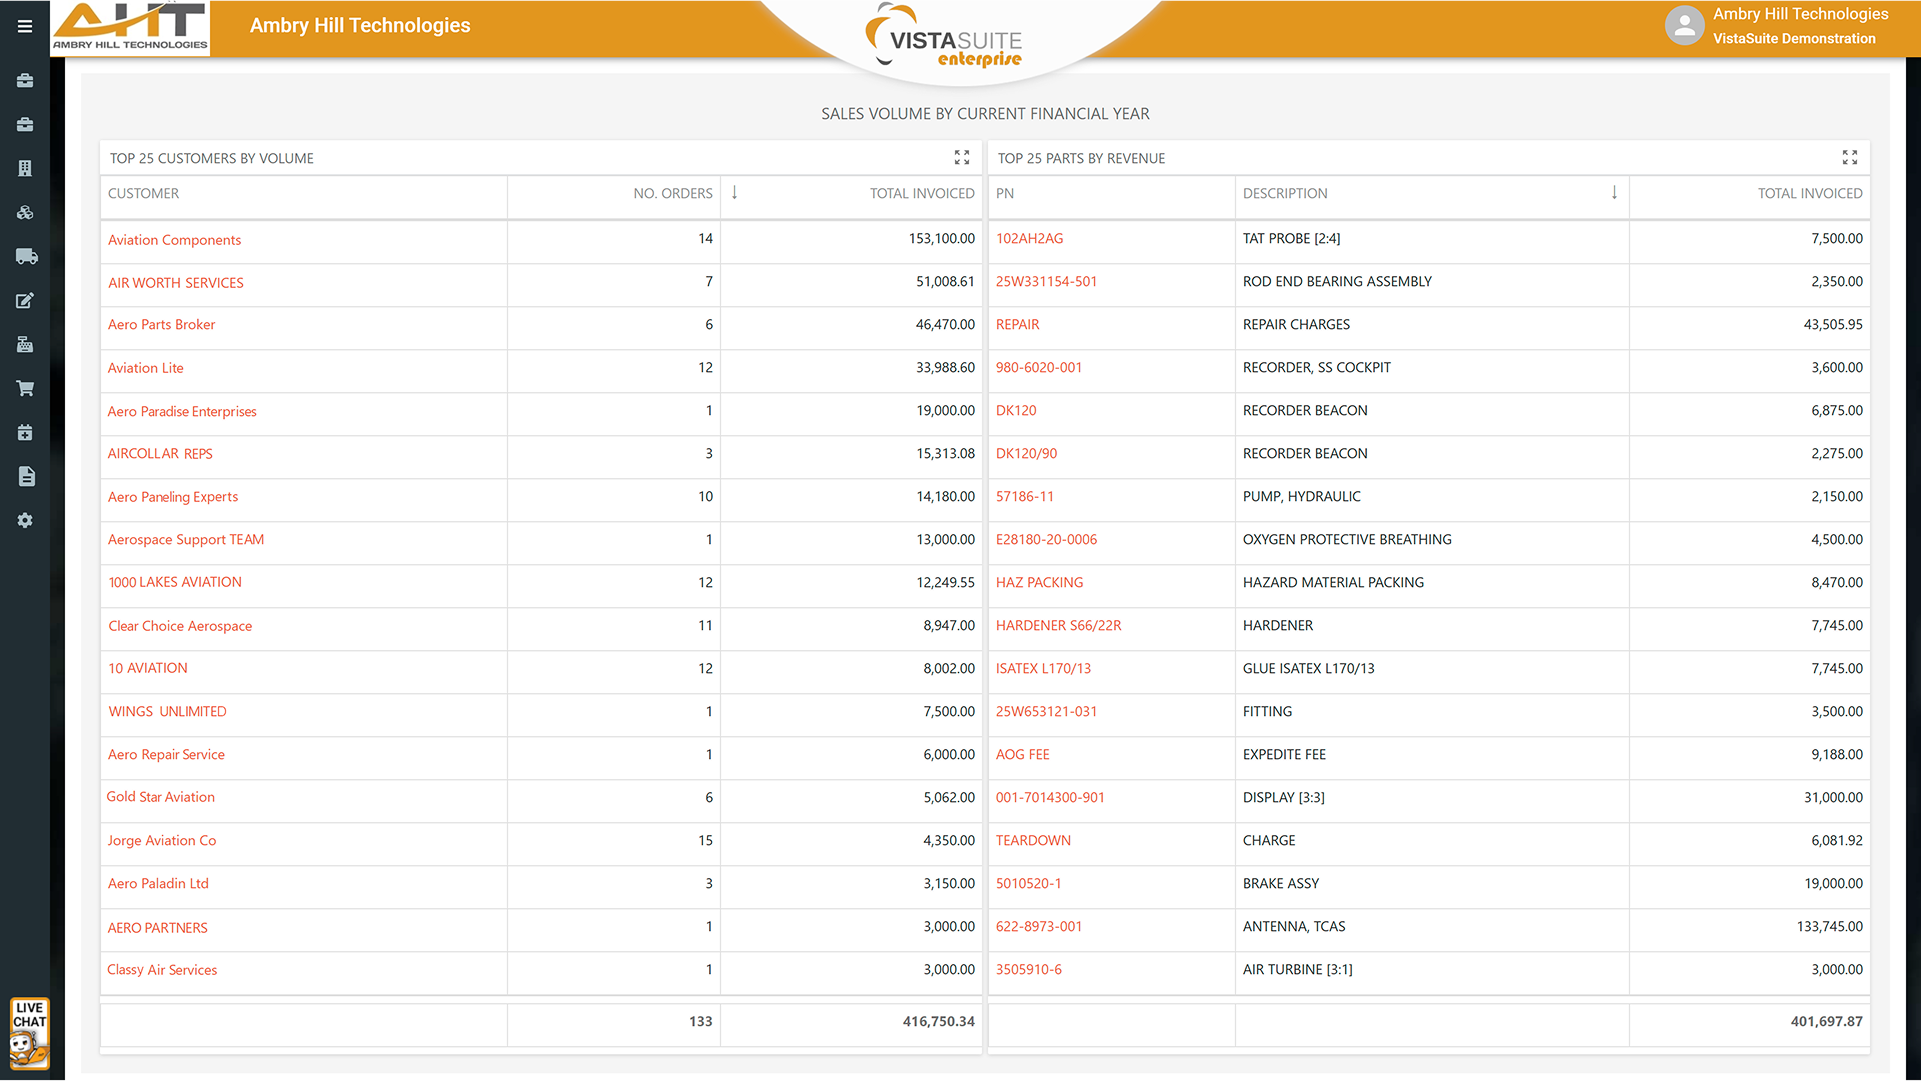
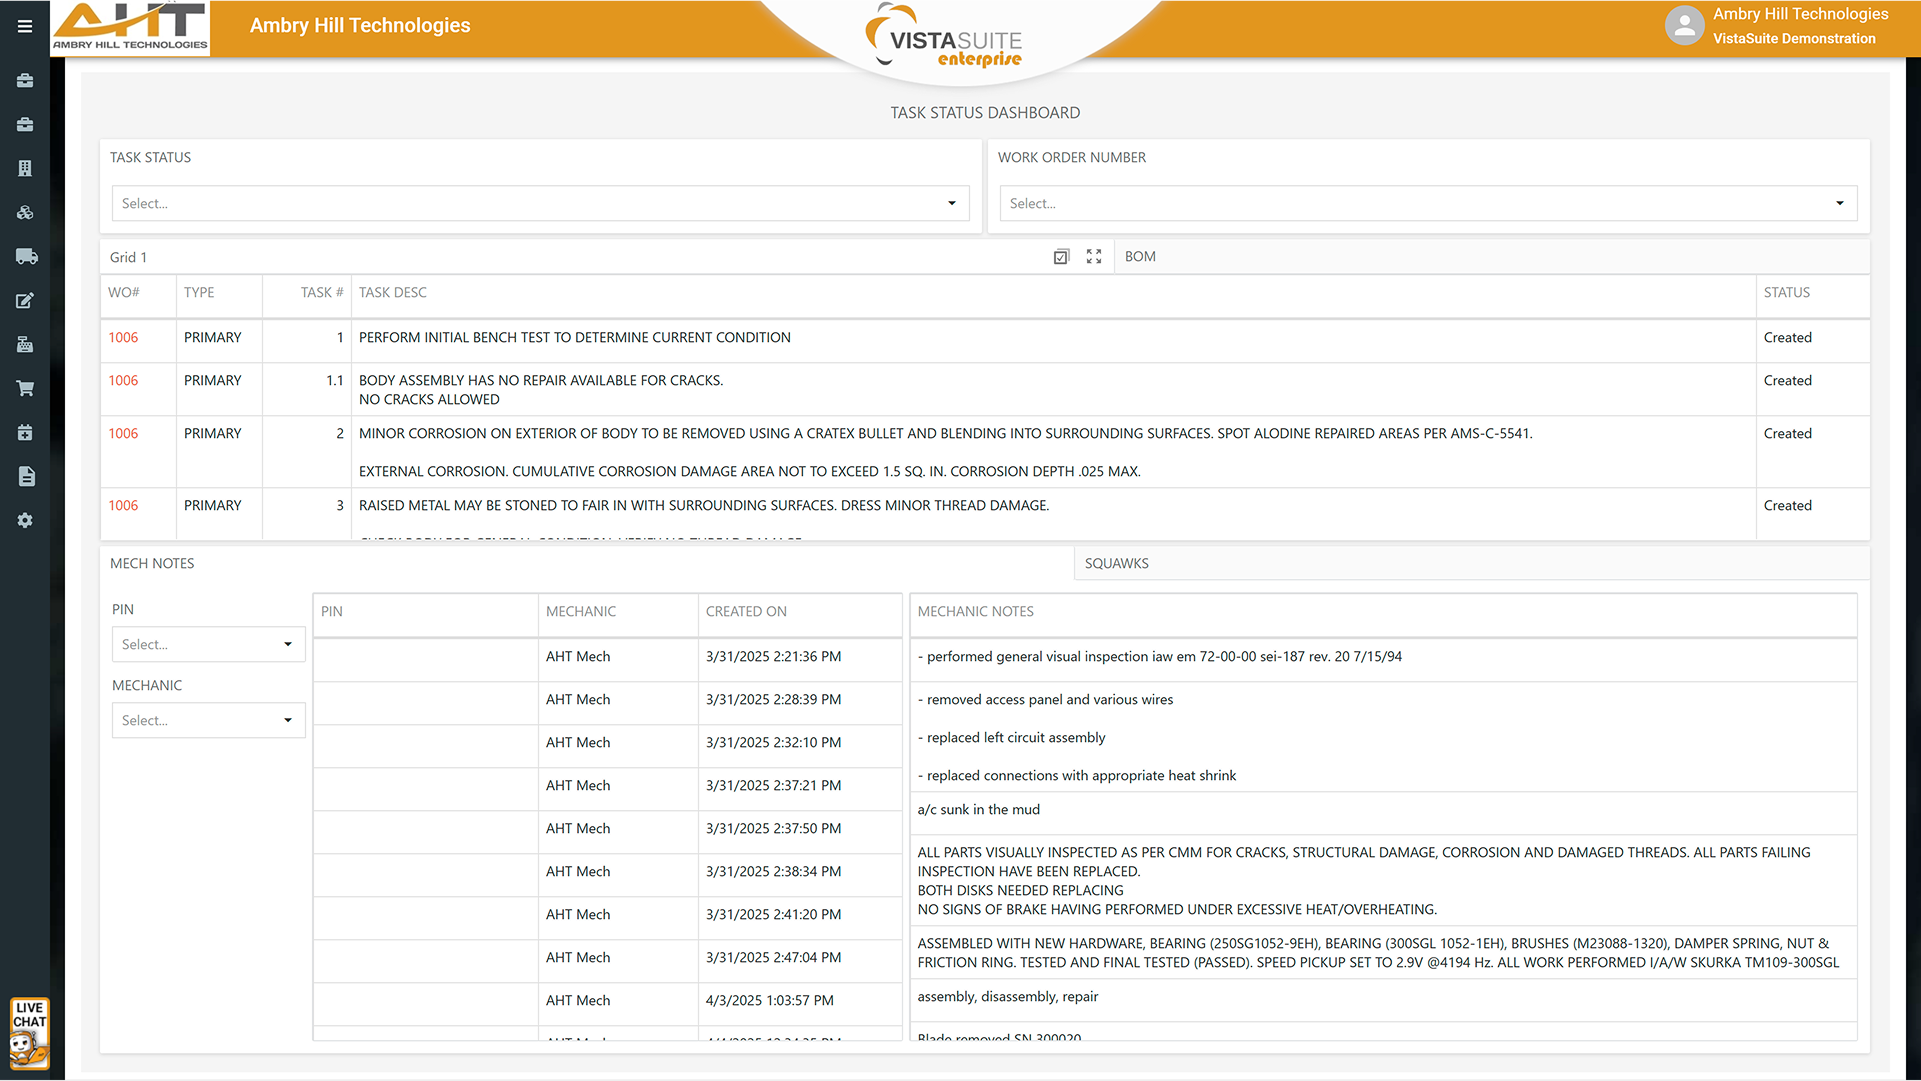
A wide range of available dashboard components that display data in clear, visual formats:
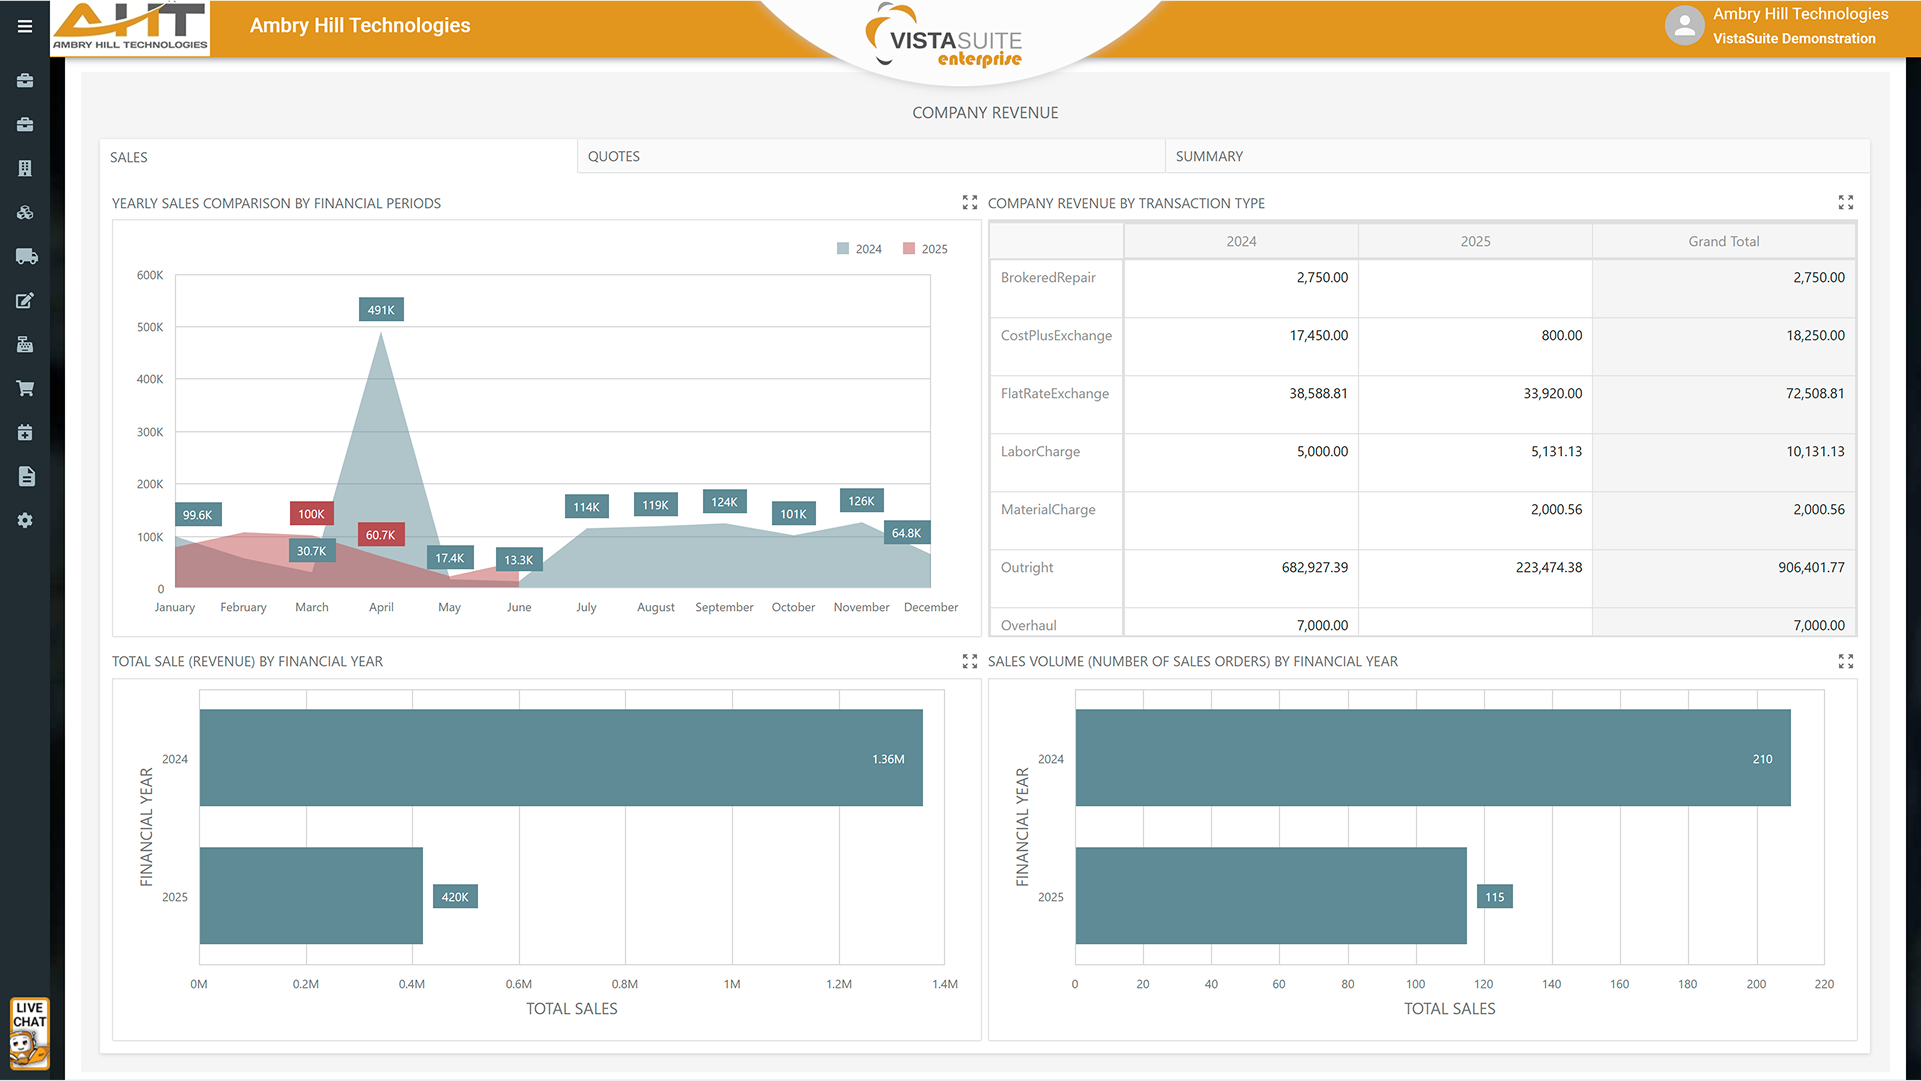
Bar, line, area, pie, and scatter charts
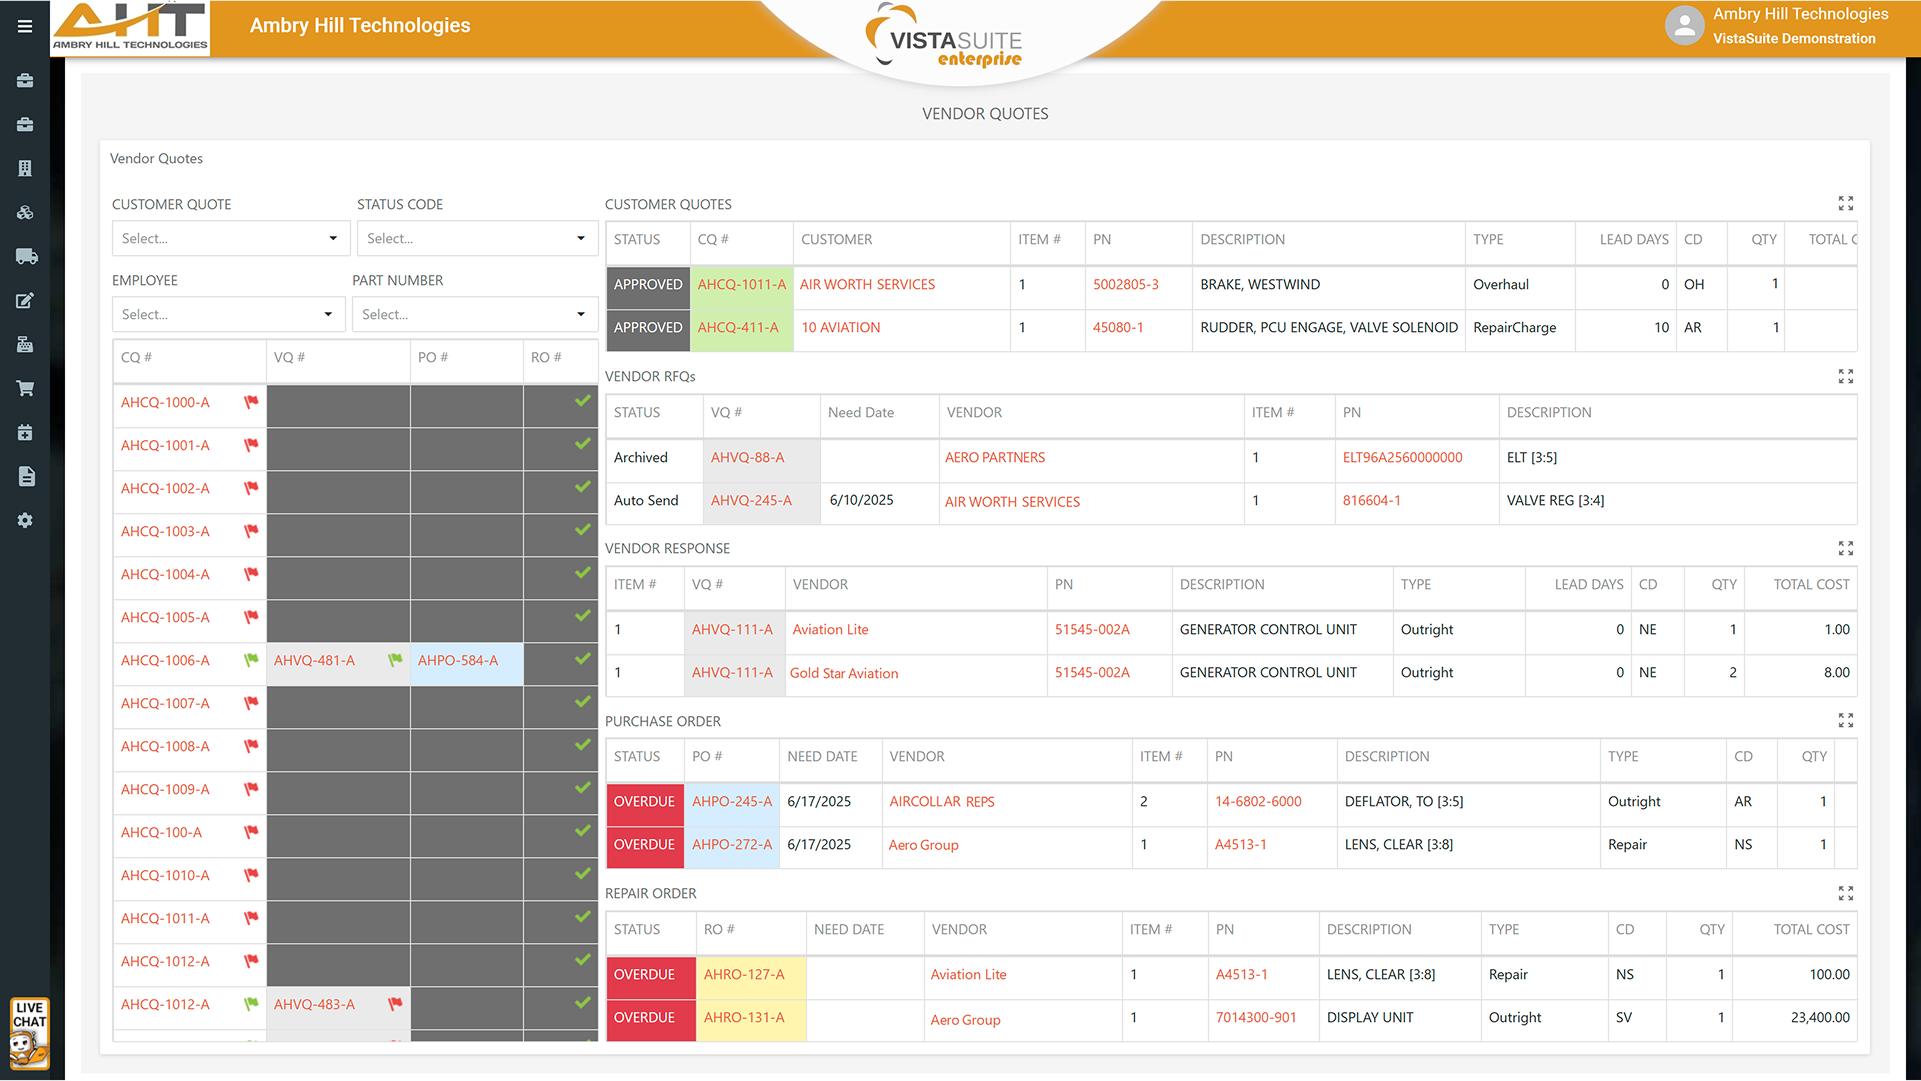
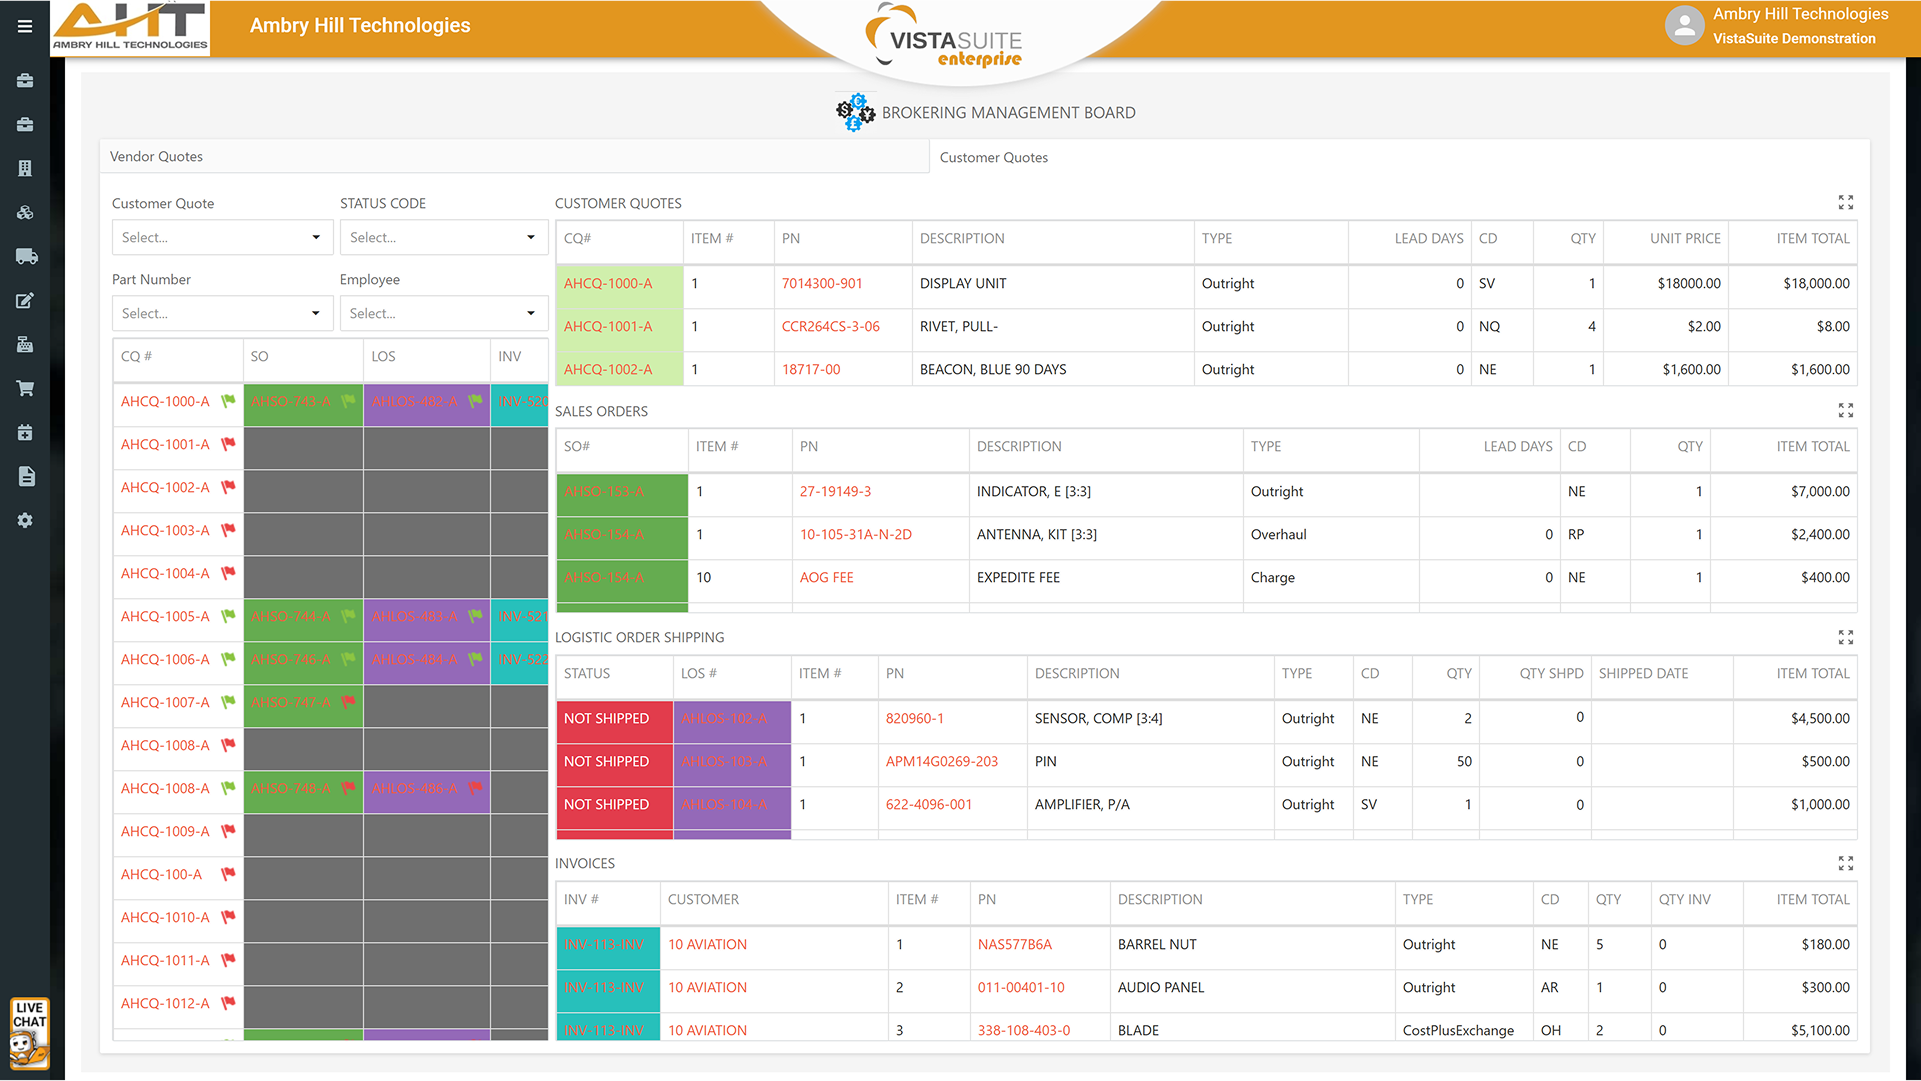
Data grids with sortable, paginated tables
Cards to compare actual vs. target values
Gauges and treemaps for quick metric visualization
Pivot tables for analyzing multidimensional data
Geographical maps with heat, bubble, and pie overlays
Text blocks and embedded images
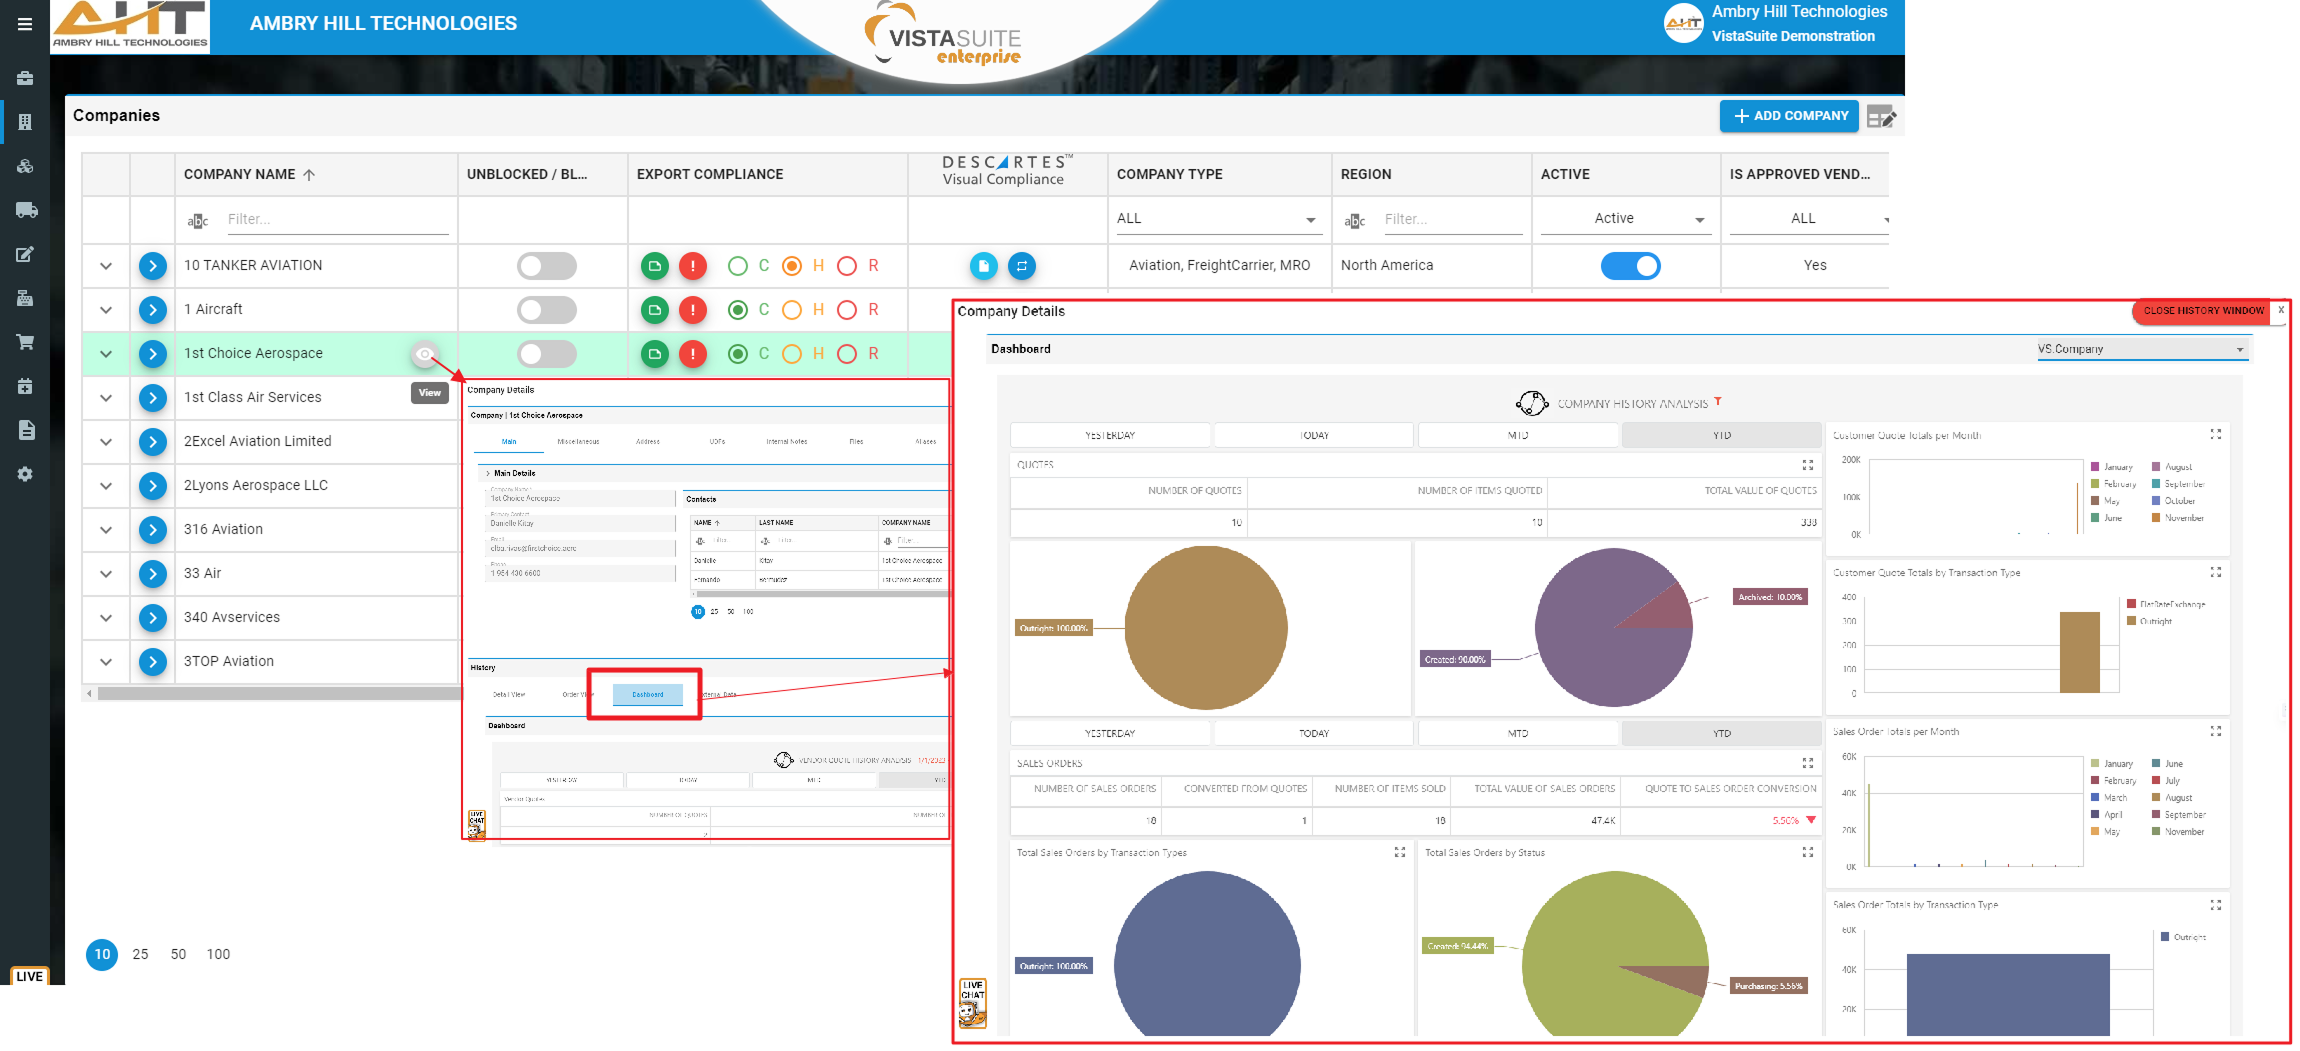
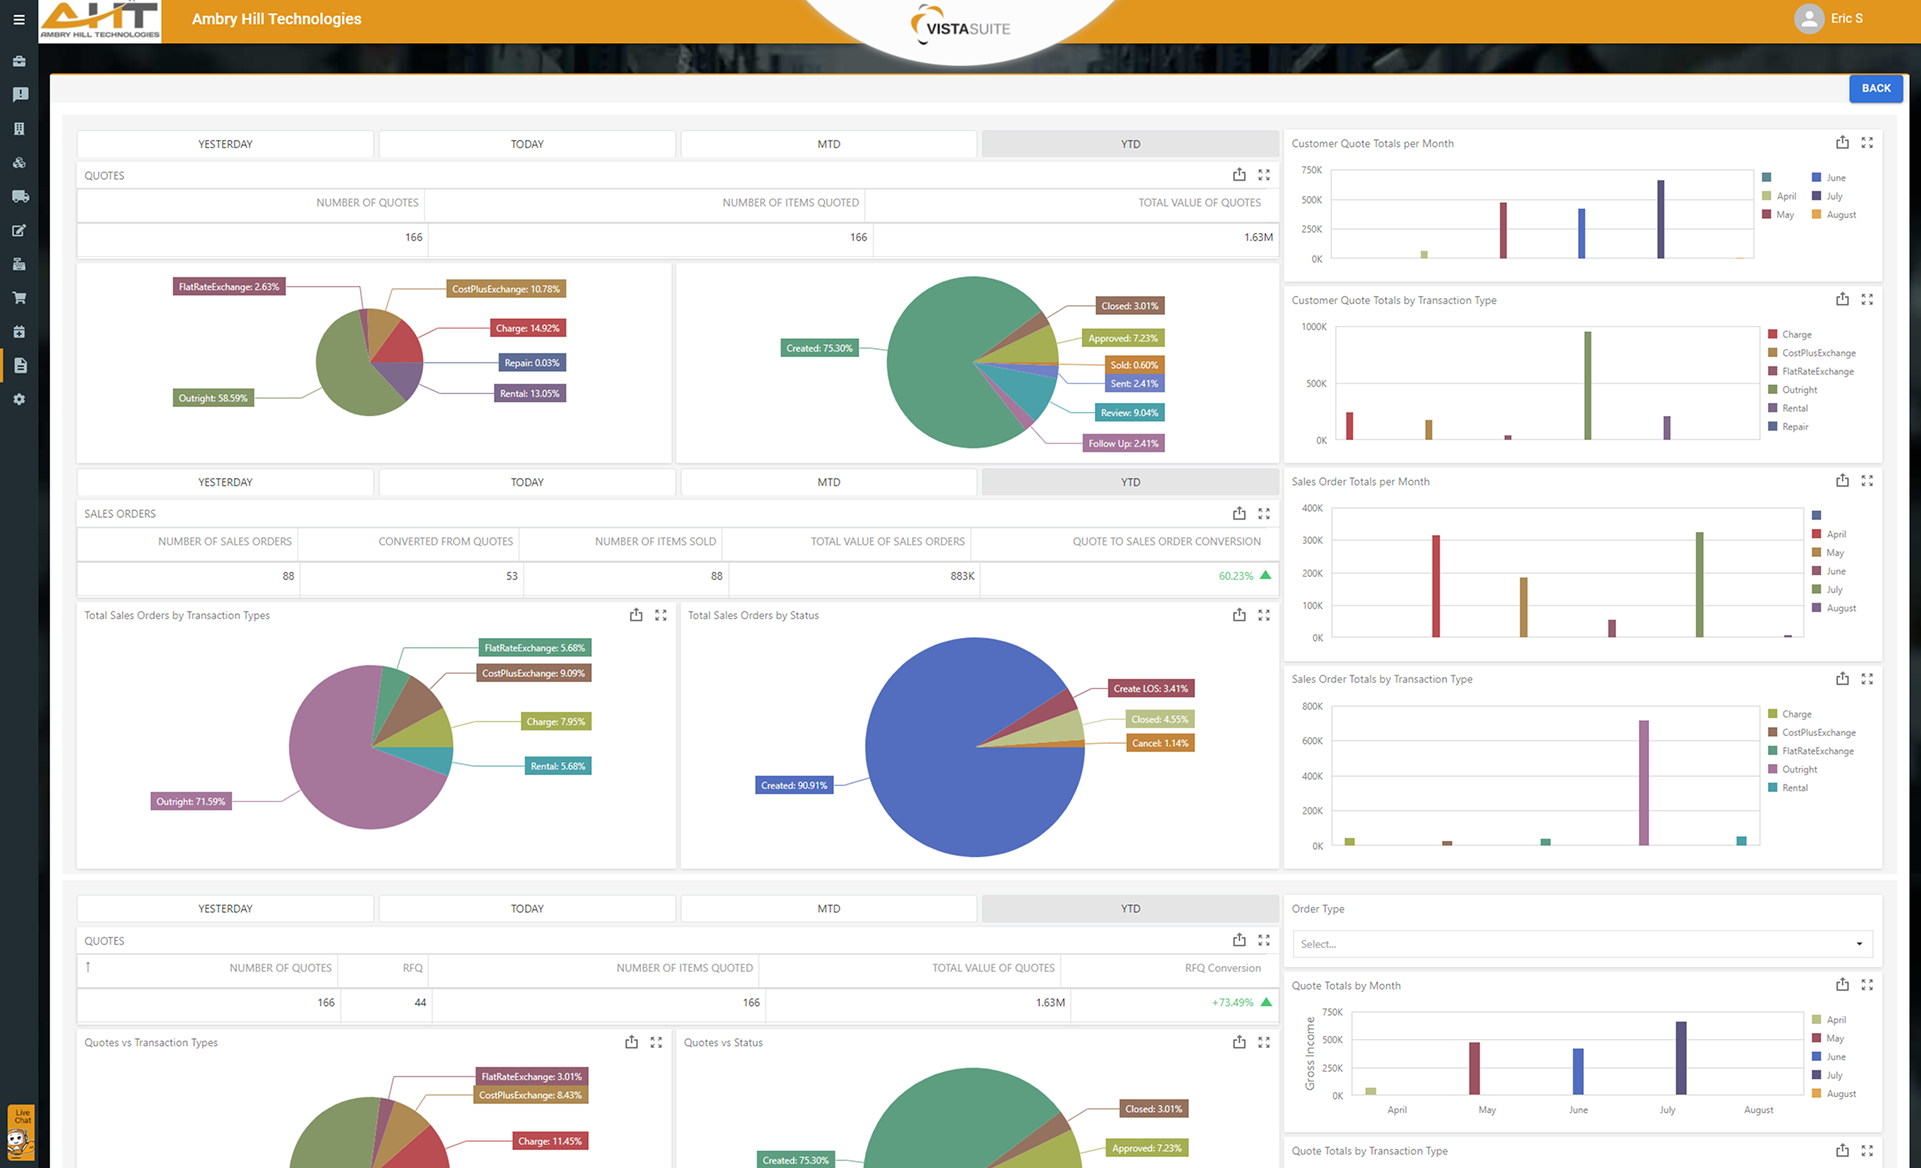
Even in view-only mode, users can interact with dashboards in useful ways:
Click on a chart segment or grid row to filter related visuals
Navigate deeper into hierarchies (e.g., from year to month to day)
Select values such as date ranges, categories, or locations to refine the data shown
In fast-paced, data-driven environments, having instant access to meaningful insights isn’t just helpful, it’s essential. The Business Analytics Dashboards in Vista-Suite Enterprise ensure that every team member, from the front office to the warehouse, can make faster, smarter decisions backed by real data. By turning complex information into easy-to-understand visuals, our dashboards empower users to stay informed, spot opportunities, and respond to challenges with confidence
See a demo by contacting sales@ambryhill.com


Software development moves fast, and features evolve over time. While we strive to keep this and other pages accurate, some information may not reflect the most recent changes. For the most current details, we recommend scheduling a live demo at ambryhill.com/demo.
Bring clarity and control to your aviation operation.